- No extra-installation needed
The same Server Monitoring agent (installed on your Server) can be used to collect Docker Host and Container metrics. This setup script will work on any Docker Host Server instance, even if you have already installed the agent for Standard or Pro server monitoring. The agent will be upgraded to also monitor Docker metrics without any loss of historical data.
The Server Monitoring agent will automatically detect if docker is installed on your system and shows the notification on server widget to enable docker monitoring as shown below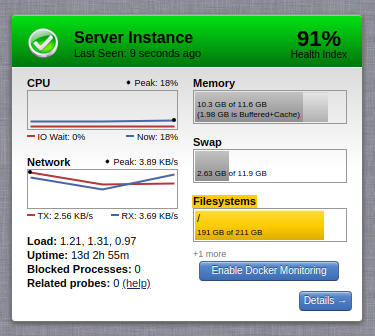
Fig : Server widget when server has docker installed
When Docker Monitoring is enabled widget will also show active containers count.
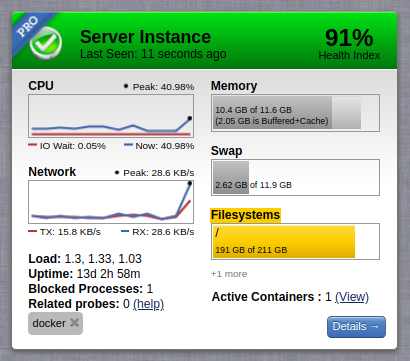
Fig : Server widget when server has docker installed and enabled Docker Monitoring
- Aggregation of Metrics
Docker container metrics can be aggregated by tags. By default container are aggregated by image.
For each Docker host its containers data is aggregated on the bases of tags applied i.e for each docker host if there are x different tags on its container then aggregation of data will be done on basis of those x tags and aggregated data can be seen on the `Docker Container Metrics` tab in server details panel. As shown below
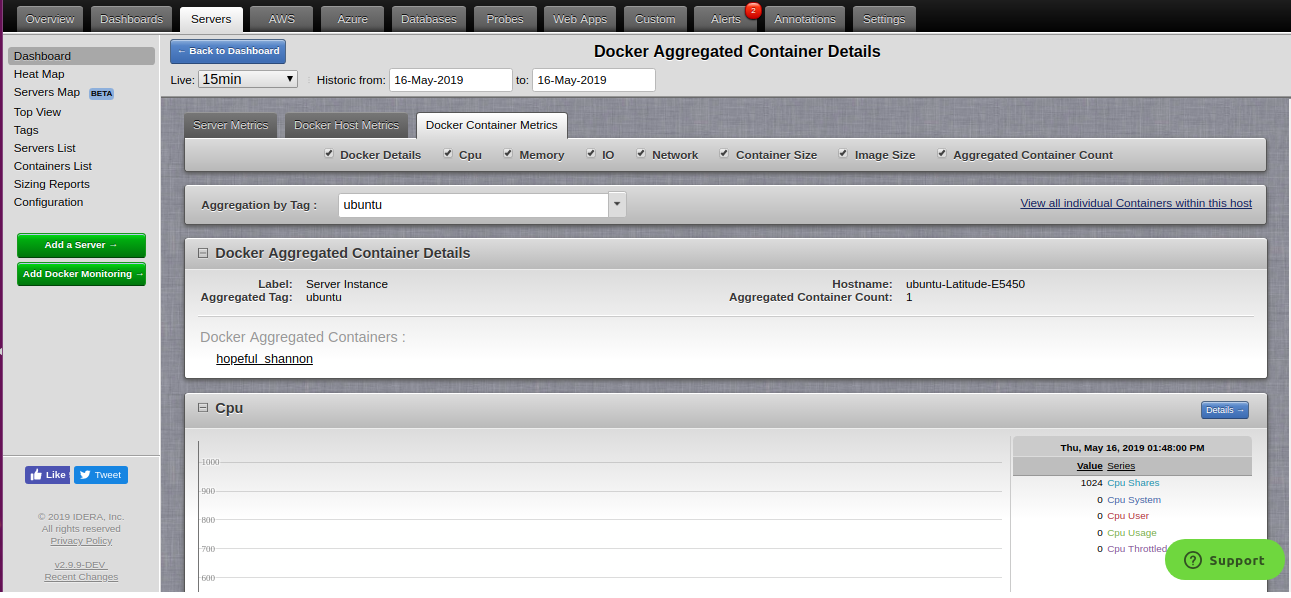 Fig : Docker Aggregated Container Metrics Tab.
- Containers Data : You can also see the complete list of docker containers for the site under the `docker container list` page and filter them as required.
To view the detailed monitoring data just click on the specific container’s details button as shown.
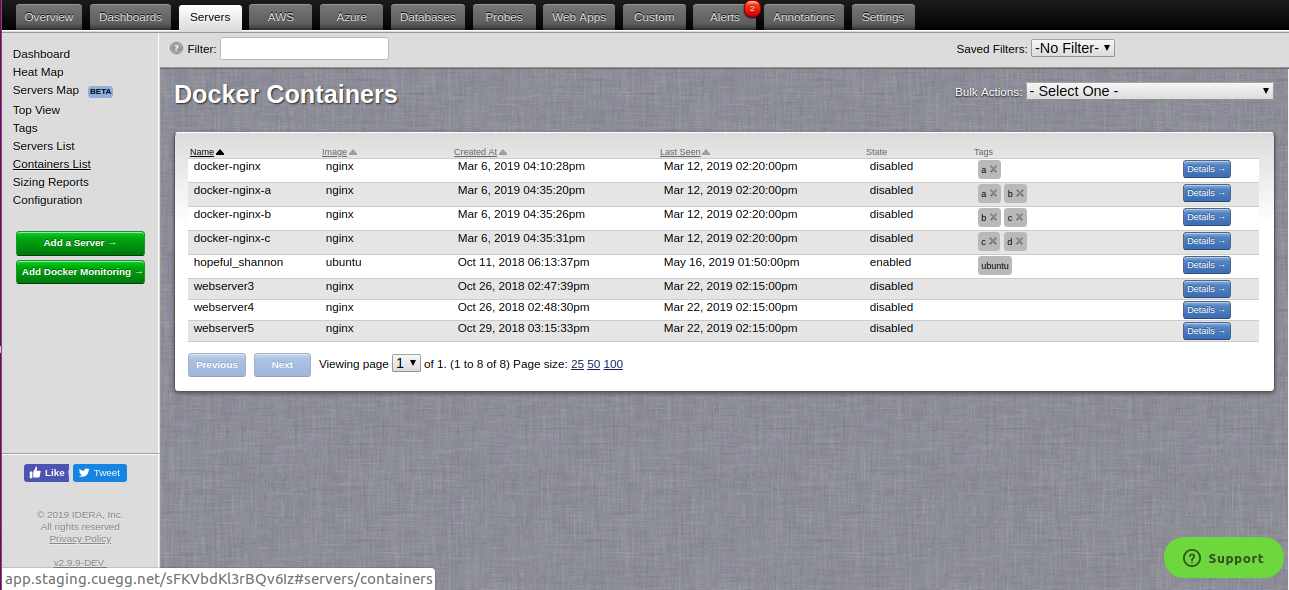 Fig : Docker Container List.
- Detailed Charts. All your Docker Host and Container metrics are charted in the Details View. The full list of Docker Host and Container monitored metrics is listed on the Documentation page.
You can view detailed charted view for docker host, docker container and aggregated docker container as well as shown :
 Fig : Docker Host Details Page.
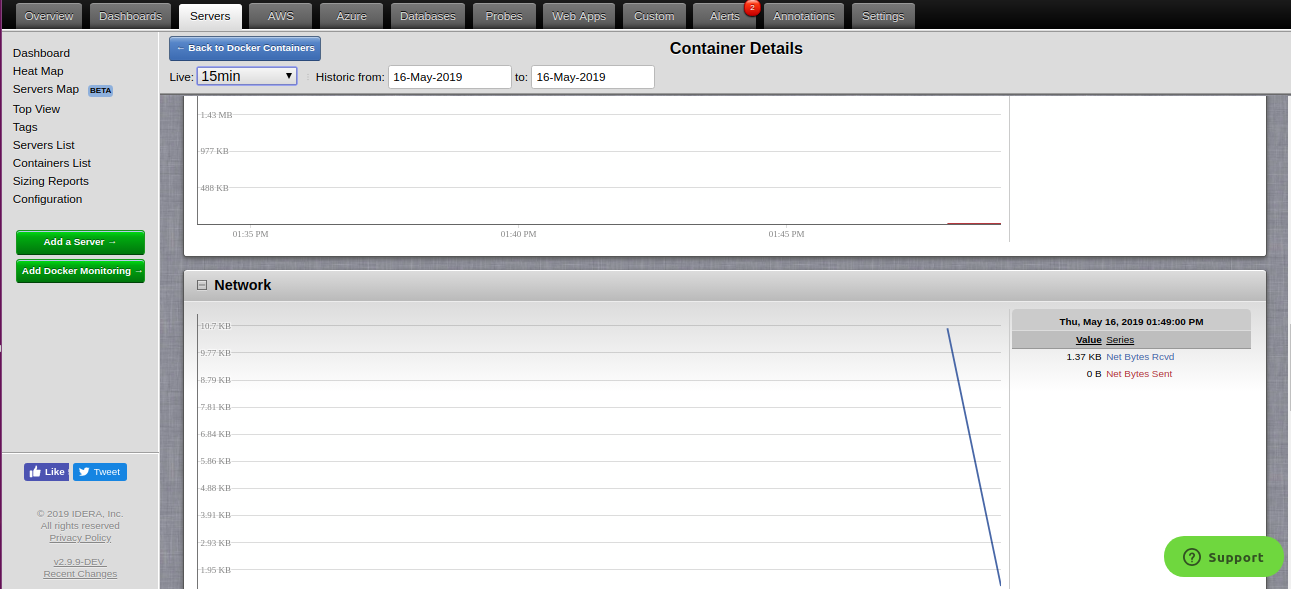 Fig : Docker Container Details Page.
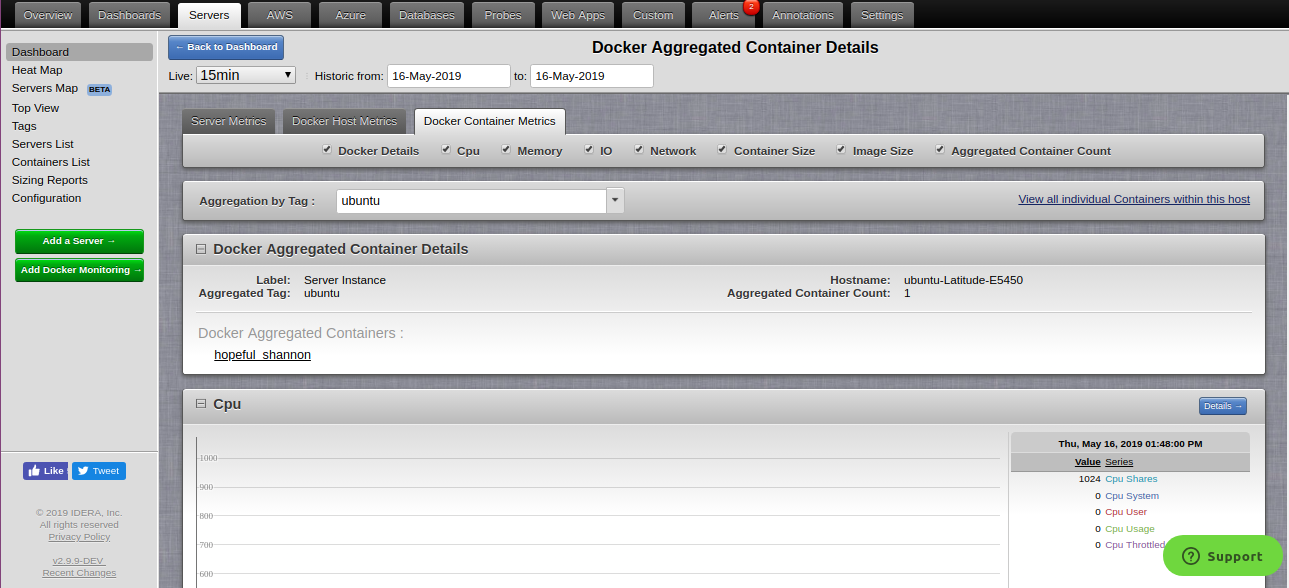 Fig : Docker Aggregated Container Detailed metric charts
 - Custom Dashboards
Create your own Custom Dashboards to display all the monitored data aggregated across your Docker Host and Aggregated Docker Containers
This is an important feature to get the graphical view of charts of a particular metric group from different sources. This is helpful in comparison of a metric across different sources.
Scenario : Suppose you have different type of application server running as a containers on different instances. And you want to view the combined memory usage for each instance of app server. This can be done by tagging app containers as some tag say ‘t1’ and then create a custom dashboard widget for matching container tag as ‘t1’ and matching host tag as ‘app-server’.
.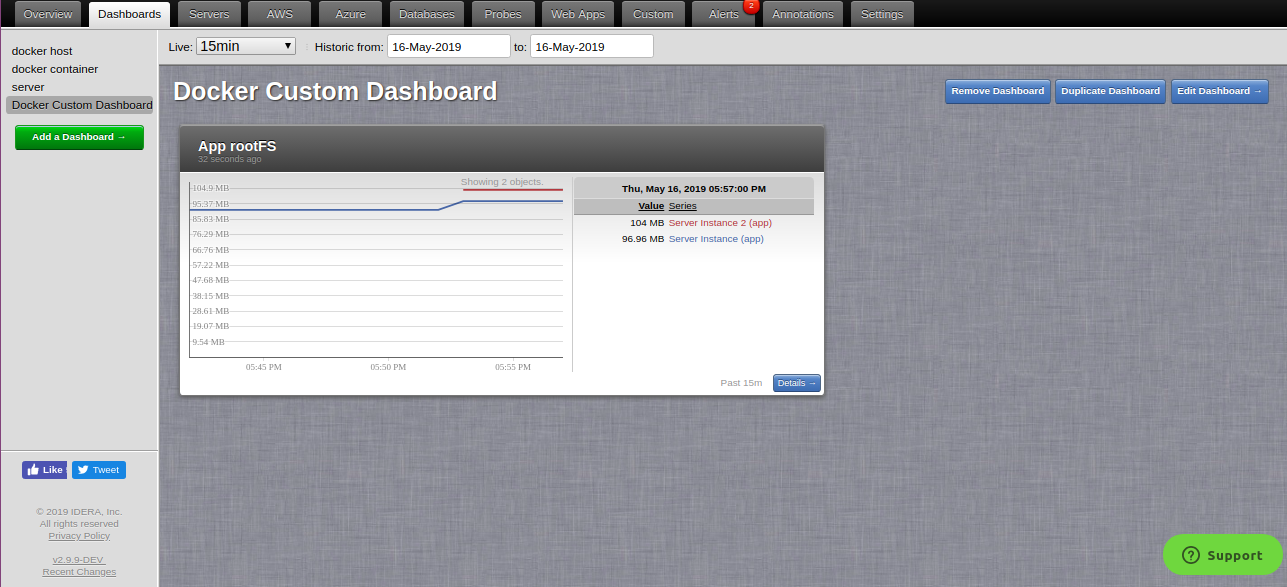 Fig : Docker Container Custom Data Widget.
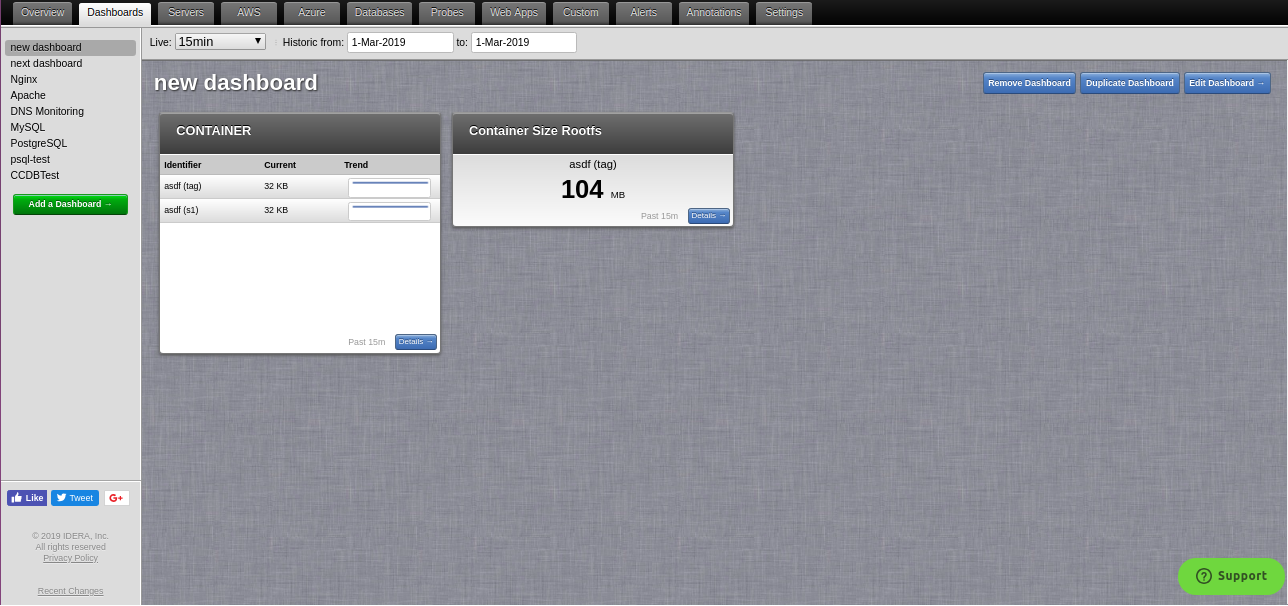 Fig : Custom Widget example
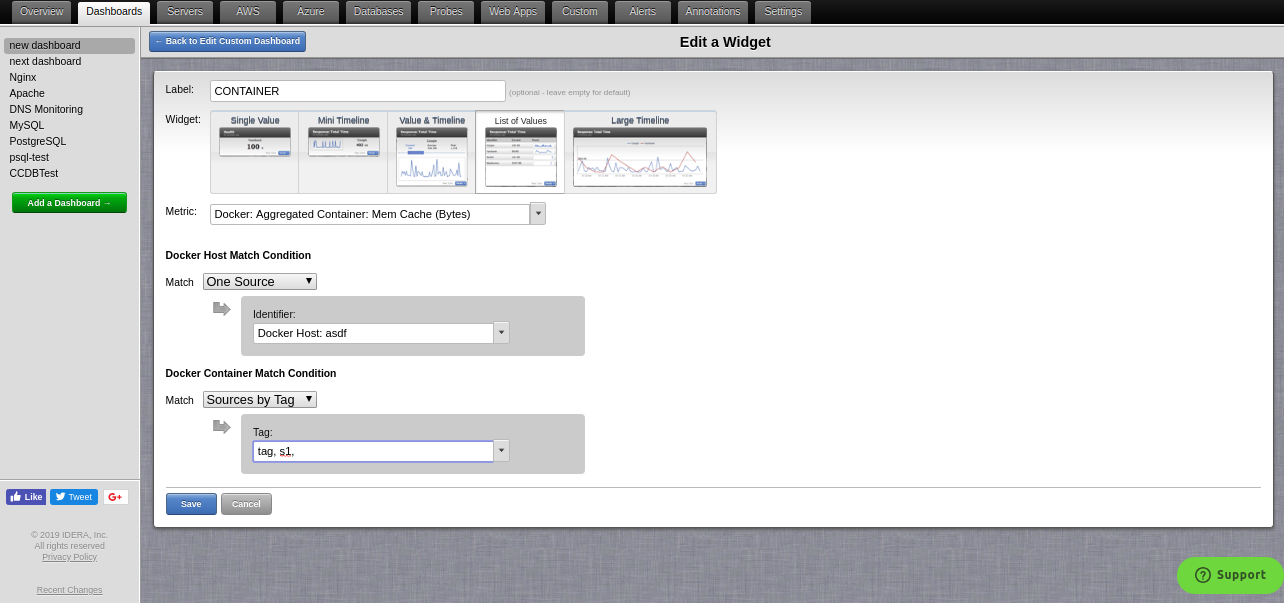 Fig : Docker Container Custom widget creation page.
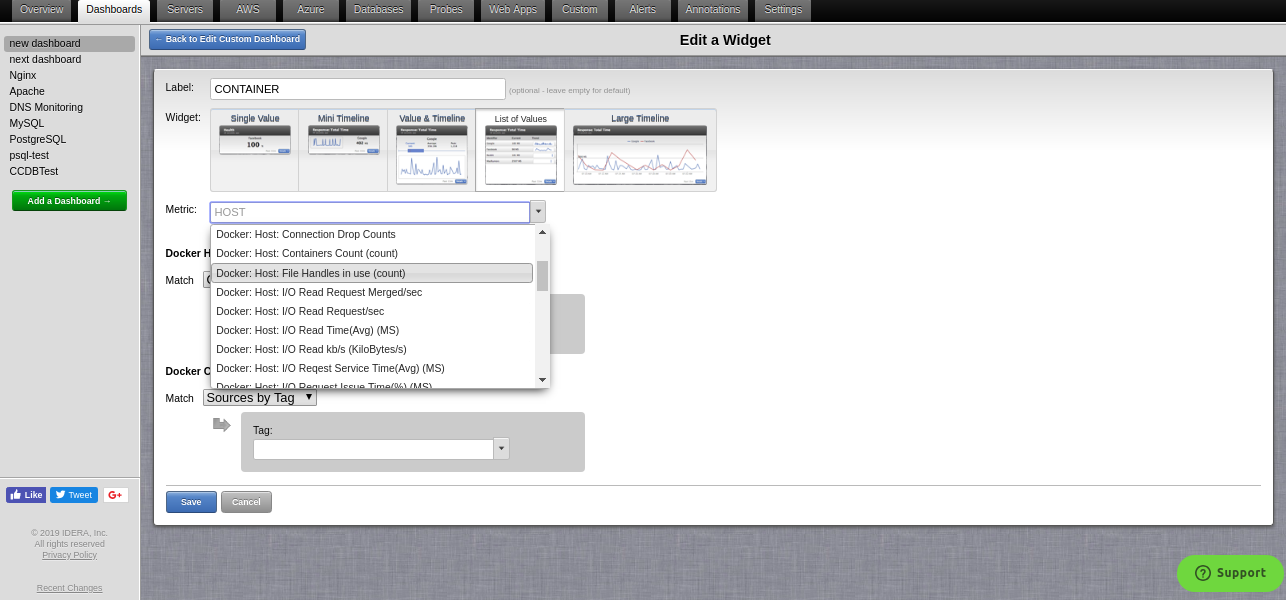 Fig : Adding Docker Host/Container Widget in custom dashboard.
- Alerts
Alerts can be added on Docker Host, Docker Container and Aggregated Docker Container’s data to get notified on various critical states your infrastructure undergoes. These alerts are applied on the bases of tags applied to your docker host or containers.
For Aggregated Docker Containers there is a support for two level selector for containers i.e first select the matching docker host and then match the containers by tag in those matching docker hosts.Sample Alerts :
Scenario 1 (Docker Host Alert) : If the ‘Inodes in use’ of all Docker Hosts having some tag say ‘t1’ exceeds 90% consistently over the past 30 mins, alert can be triggered. This alert will check for all the docker hosts having tag ‘t’ for the configured alert.
Scenario 2 (Docker Container Alert) : If the ‘Inodes in use’ of all Docker Hosts having some tag say ‘t1’ exceeds 90% consistently over the past 30 mins, alert can be triggered. This alert will check for all the docker hosts having tag ‘t’ for the configured alert.
Scenario 3 (Docker Aggregated Container Alert) : If the ‘Inodes in use’ of all Docker Hosts having some tag say ‘t1’ exceeds 90% consistently over the past 30 mins, alert can be triggered. This alert will check for all the docker hosts having tag ‘t’ for the configured alert.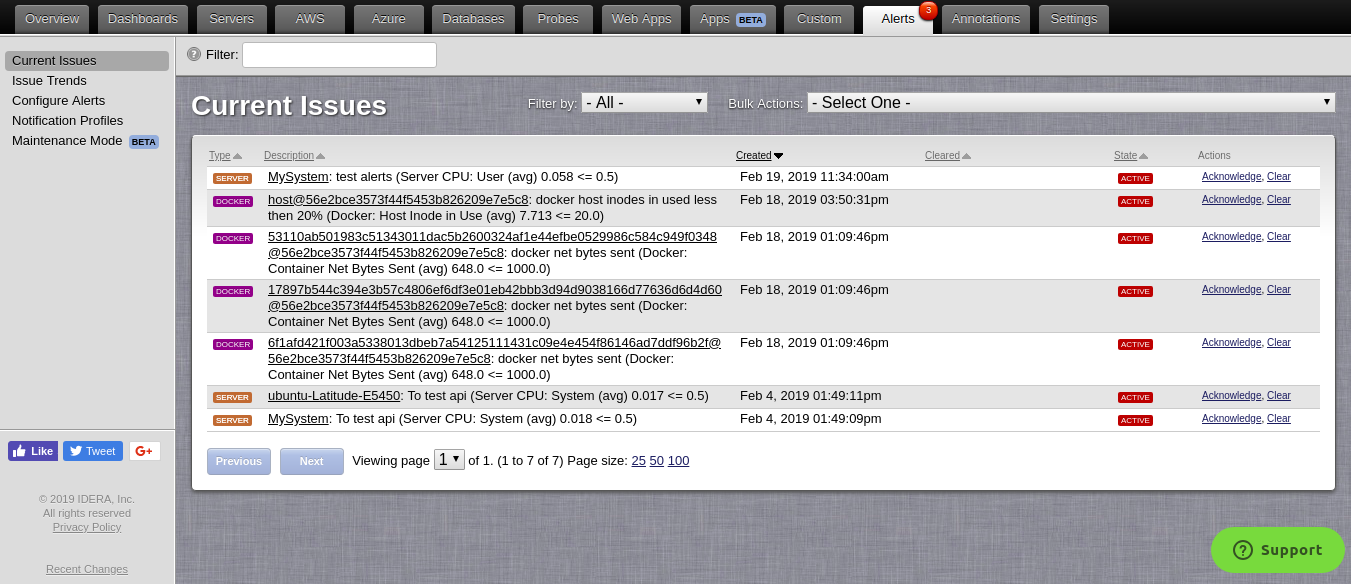
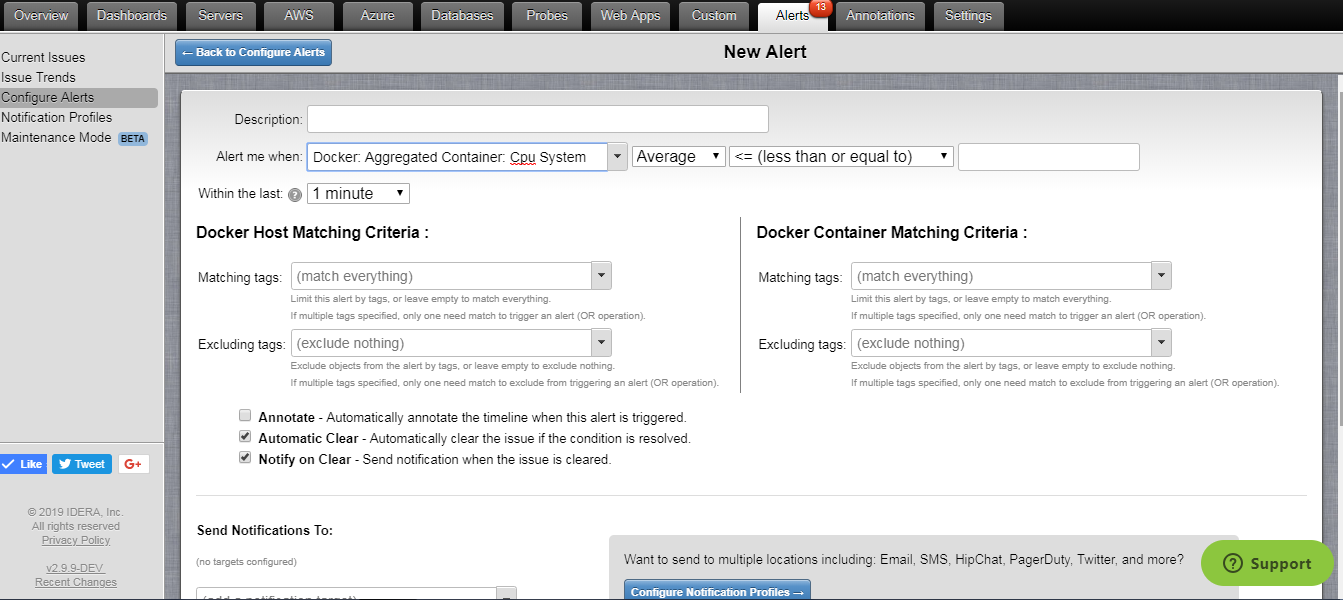 Fig : Docker Host/Container Alert Configuration page.
 - Historical Data Retention
We retain historical data for a year for all active Containers. For terminated Containers, we retain historical data for 500 (most recent) Containers for every host for 3 months.
Pricing:
We charge $1 per month per active Container. Historical data for upto 500 terminated Containers per host will also be retained without charge. You can also reserve the number of Containers in advance to get a 20% discount. The number of actively monitored Containers is calculated on an hourly pro-rated basis.
Illustration: Suppose that in a month with 30 days, you had 10 actively monitored Containers during the first 10 days of the month, 15 actively monitored Containers during the next 10 days and 20 actively monitored Containers during the final 10 days of the month. The pro-rated average number of actively monitored Containers for the month would be 15. Suppose that you had reserved 10 Docker Containers. Then, at the end of the month, you would be billed for:
10 Reserved Docker Containers = 10 * 0.8 = $8
5 On-Demand Docker Containers = 5 * 1 = $5
Total = $13