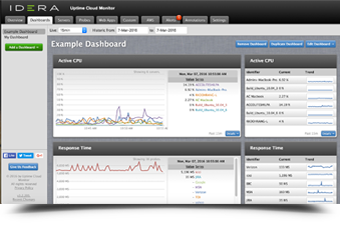
Visualize Your Cloud Infrastructure Performance in Seconds
CopperEgg
- Integrate with Tools You Use
CopperEgg brings all of your data together in one place, pulling data in from tools you already use with out-of-the-box integrations and an Open API. - NGiNX
Pull metrics from your NGiNX web server, such as requests and connections and view on a unified dashboard. - Apache
Monitor requests, bytes and workers information, and CPU load on your Apache web servers. - MySQL
Out of the box, this plugin allows you to monitor 10 metrics including query information, cache hits, table locks, open files/tables, and more. - PostgreSQL
Get insight into PostgreSQL metrics including block hit, rollbacks, locks, commits, and more. - Microsoft SQL Server
Monitor essential Microsoft SQL Server metrics, including page life expectancy, SQL compilations per second, batch requests per second, etc. - MongoDB
Improve MongoDB performance by understanding the health and performance of your database. Get performance data on 30 MongoDB metrics. - Chef
Automatically install CopperEgg on new servers with populated metadata to more efficiently tag, filter, and alert on instances. - Puppet
Integrates with Puppet to automatically configure and update both website and server monitoring to complete the automation loop. - Redis
Monitor, alert, and quickly view 25+ Redis metrics such as client information, processed commands, CopperEgg, number of keys and more.


