You can monitor your AWS account using CopperEgg. All you need to do is add your AWS account and you are good to go. CopperEgg provides detailed information in a graphical representation for it’s users facility . Below is the list of all the services that we can monitor for you-
- Compute-
- EC2 instances
- EBS volumes
- Classic,Application,Network ELB
- Target Groups
- Auto scaling groups
- Storage and content delivery
- CLoudfront
- S3
- Storage Gateway
- Networking
- Route53
- Databases
- RDS
- DynamoDB
- ElasticCache
- Redshift
- Deployment and management
- Opwork
- Analytics
- EMR
- Kinesis
- Machine Learning
- Application Services
- SQS
- SWF
- CloudSearch
- Mobile Services
- SNS
All of these in a single easily navigable console which displays data for all of your resources present in any region.
We at CopperEgg not just provide monitoring of these services but also keep you updated about unusual behaviors by sending alert notifications via SMS, email or twitter etc.
Prerequisites-
- CopperEgg account
- AWS account
AWS Monitoring-
- Add your AWS account to CopperEgg
- Verify that AWS account has been added successfully
- Monitoring AWS account
- Configure alerts to be notified about server’s performance issues
Step 1: Add AWS account to CopperEgg
- Sign in to CopperEgg – Use the login credentials you used while signing up or you can also Sign in via Google
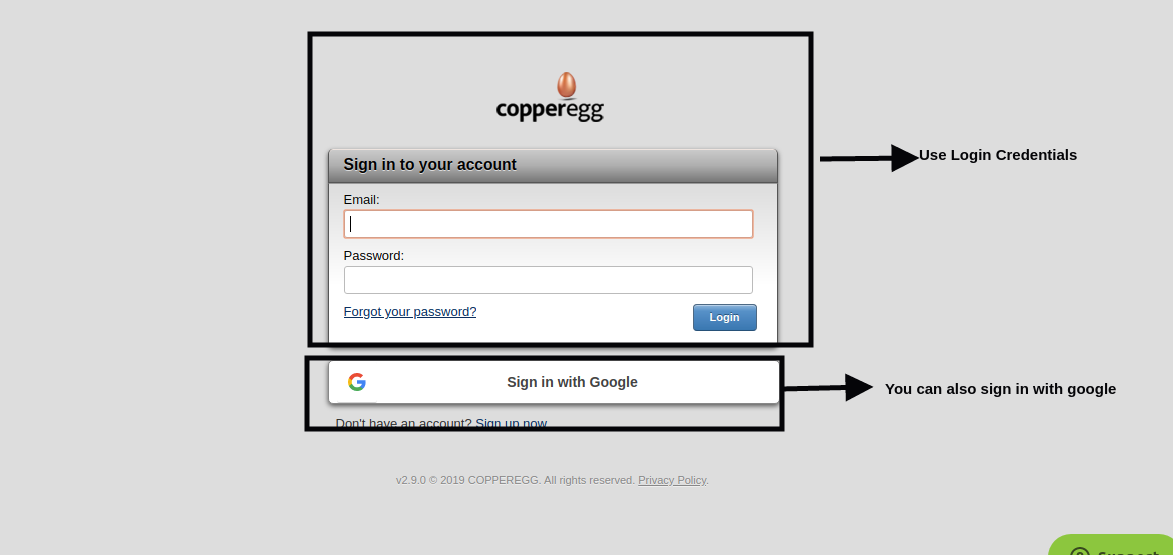
Figure 1: Sign in to CopperEgg
- Click on AWS tab and then on Click here.
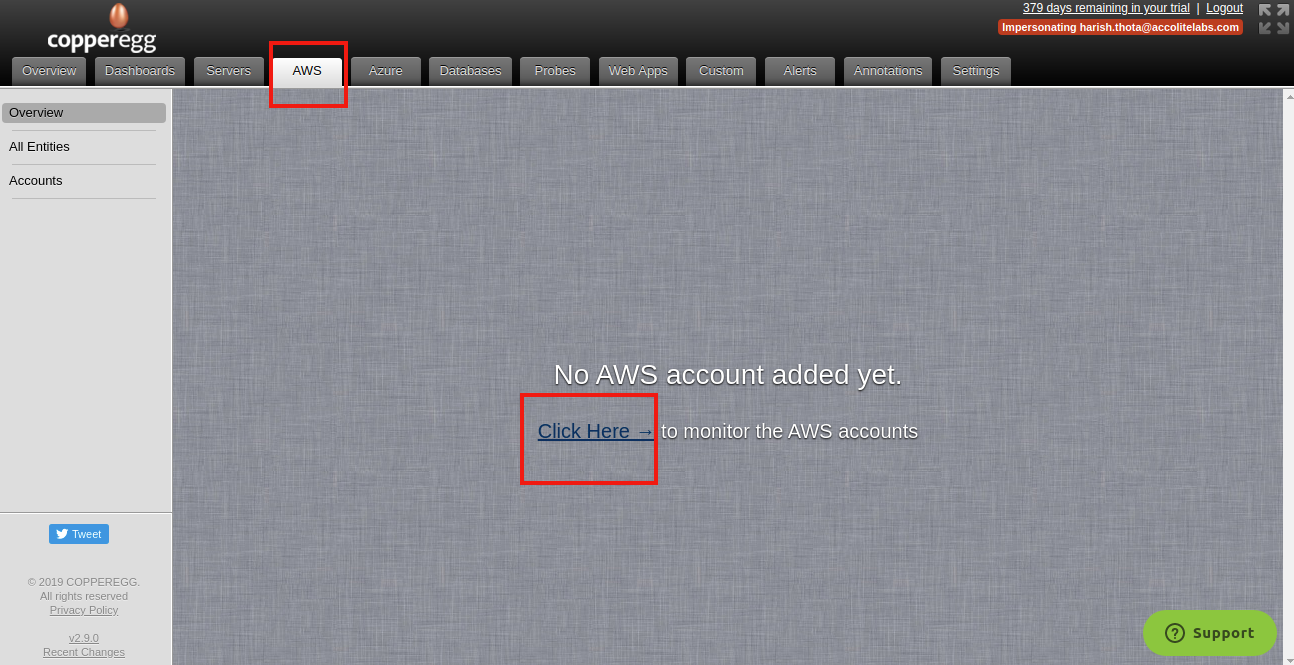
Figure 2: Add AWS account to CopperEgg
- Enter your AWS account number and click on Next
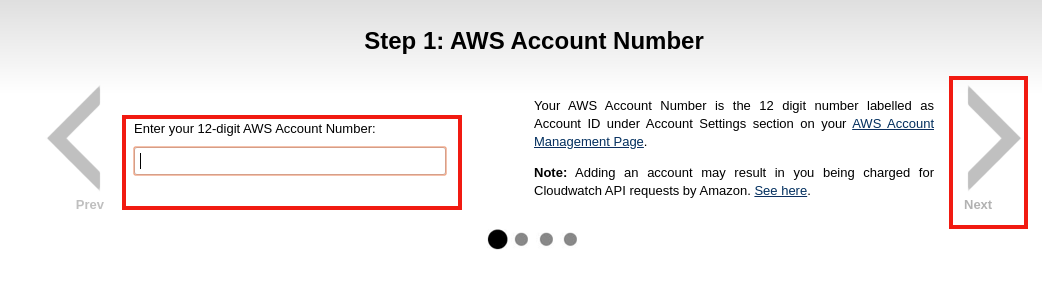
Figure 3: Add AWS account number
- Create a Read Only Role in AWS and do the Permission Setup
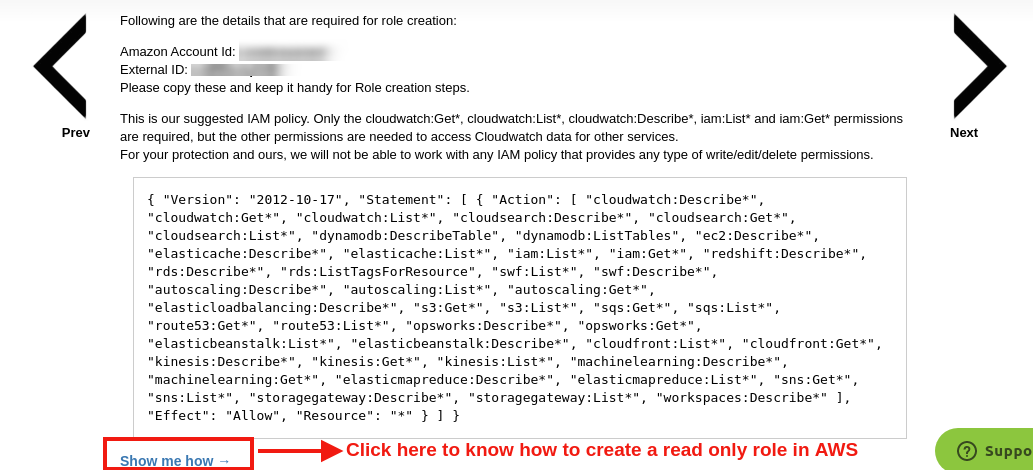
Figure 4: Add AWS account number
- Enter your AWS Role ARN and click on Next.
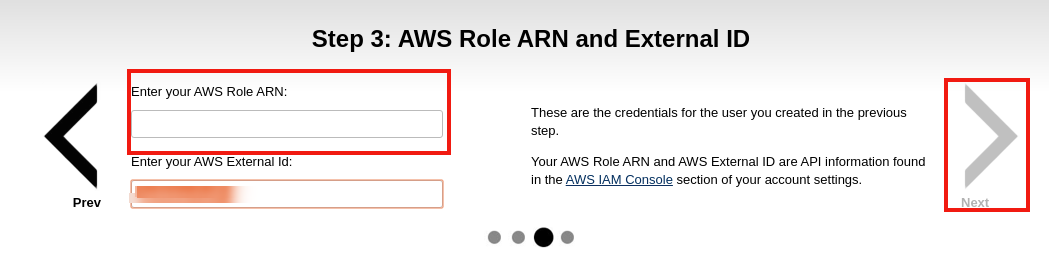
Figure 5: Add AWS Role ARN
- Enter Account Label,Tags and click on Done
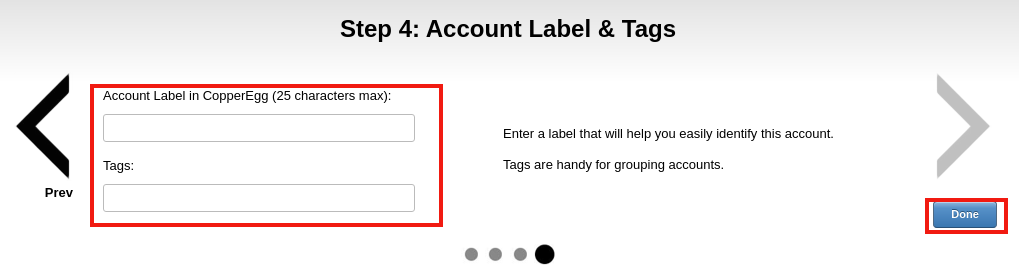
Figure 6: Add account label and tags
Step 2: Verify that AWS account has been added successfully
- Navigate to AWS tab you will now be able to see data is transferred between your AWS and CopperEgg account.
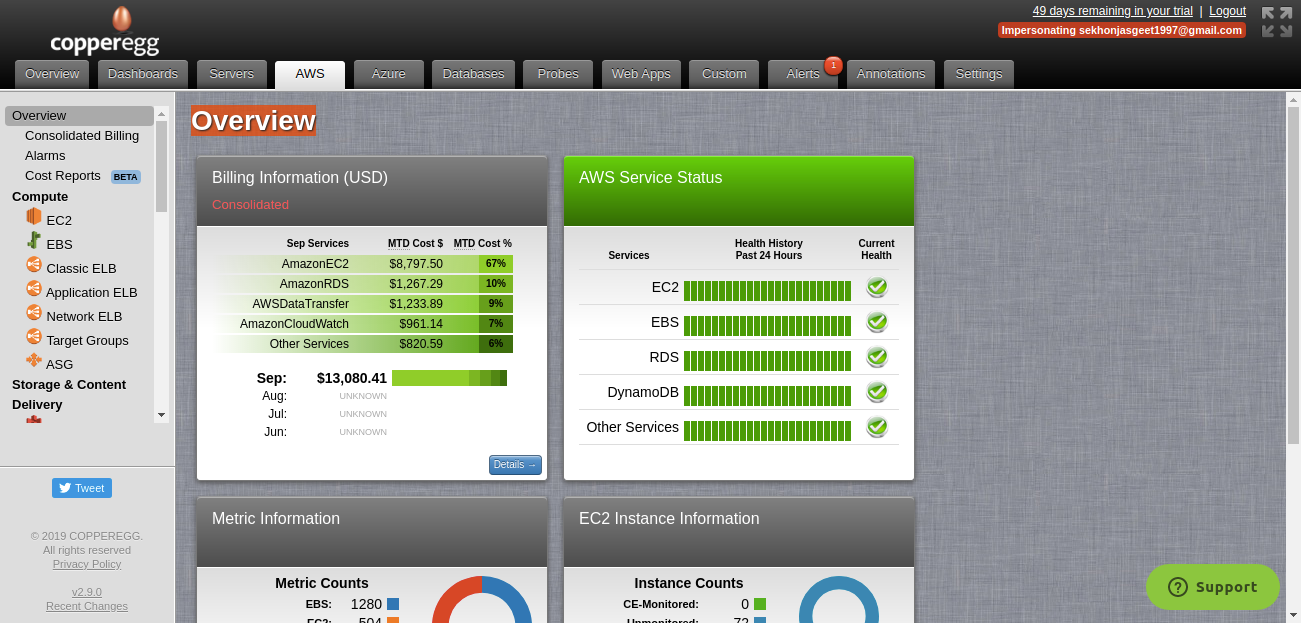
Figure 7: AWS account added to CopperEgg
Step 3: Monitoring AWS account
- In the left panel you can see various services including
- Overview
- Compute
- Storage and Content delivery
- Database
- Networking and more
Now we will discuss each of these in detail.
-
- Overview(refer to Figure 7 for overview tab)
- In here you can see the overview of your total aws cost
- The health of your AWS resources
- Metric information of your resources
- EC2 instance information
- Consolidated billing-
- This section gives a graphical representation of your monthly AWS bill which is subdivided among different resources.
- Overview(refer to Figure 7 for overview tab)
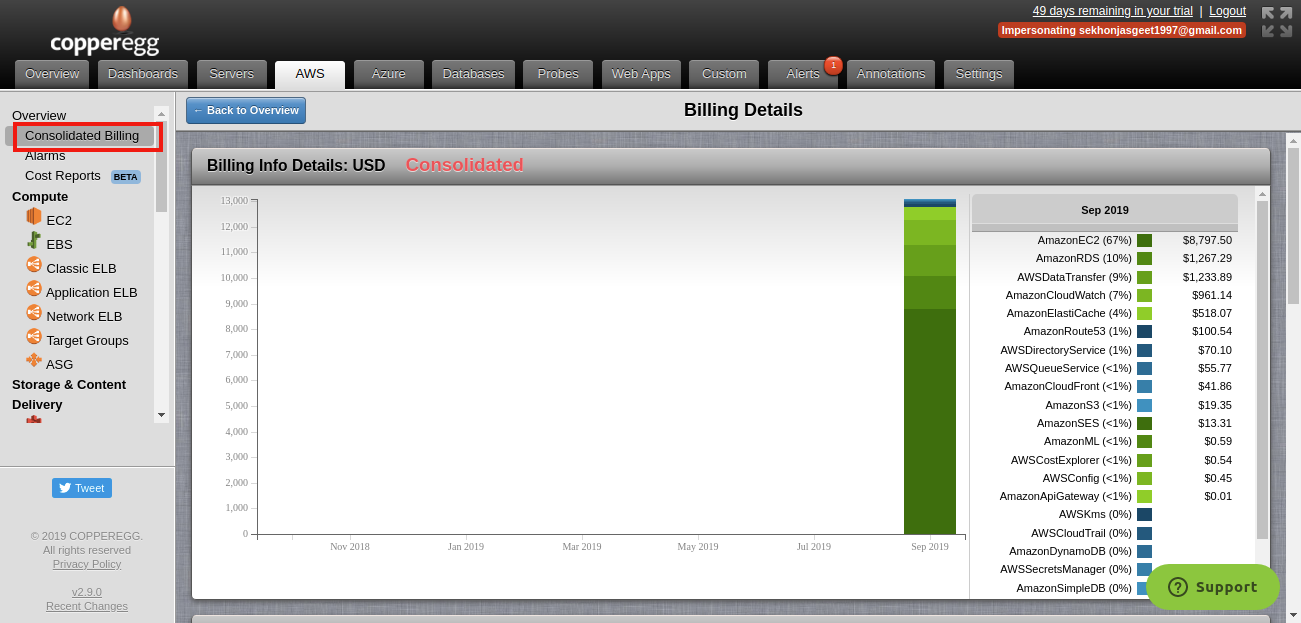
Figure 8:Billing information for AWS account
-
- Alarms-
- In this section alarms are displayed for threshold that don’t meet.
- Alarms-
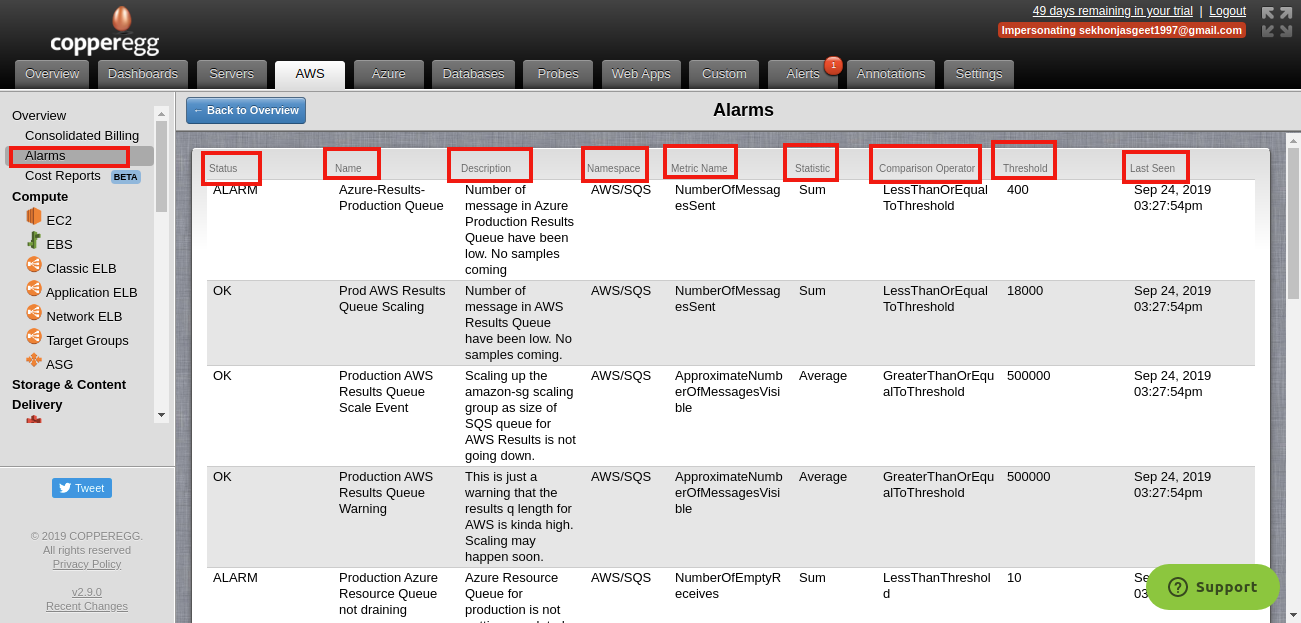
Figure 9:Alarms for AWS account
-
- Cost Reports-
- You can generate a detailed cost report for all your EC2 instances and RDS database with respect to their Region, Availability Zone,Instance Type,Platform etc. by clicking on New report button ->Save
- You can download this report by clicking on XLS.
- Cost Reports-
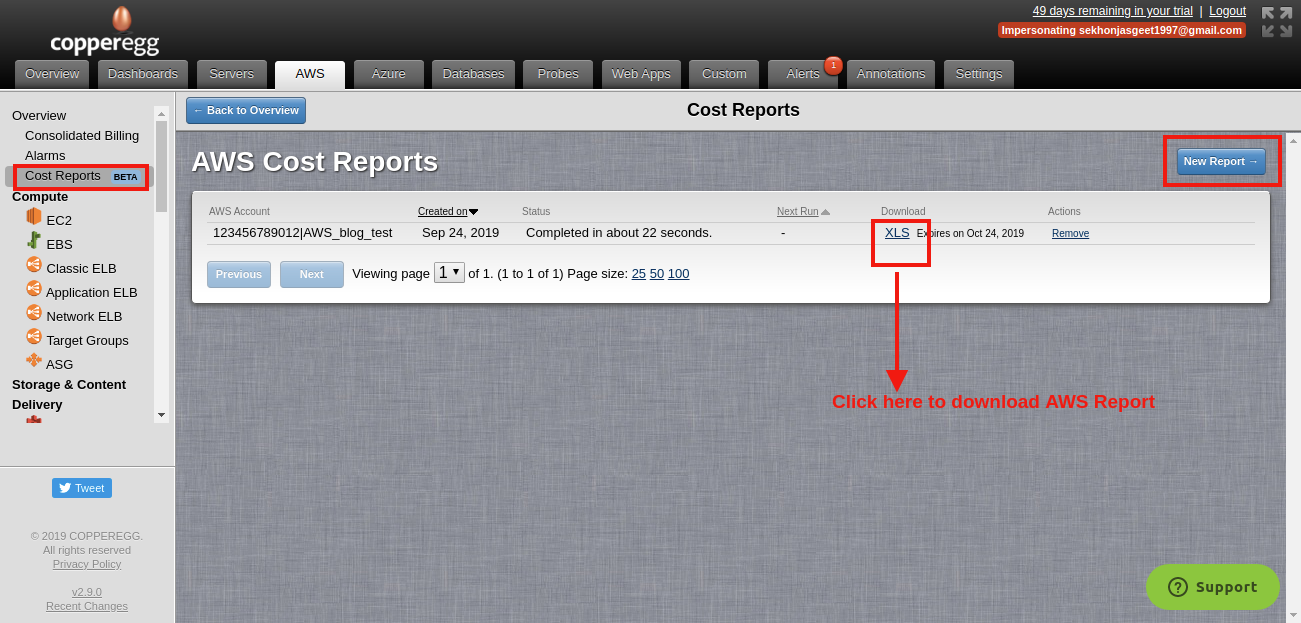
Figure 10:Cost Report for AWS account
-
- EC2
- In this section you can view all your AWS-EC2 instances.
- Apply Filter in order to see particular instances
- Click on Details to get more information about particular instance’s
- CPU
- Network
- Disk Activity
- Disk IOPS
- EC2
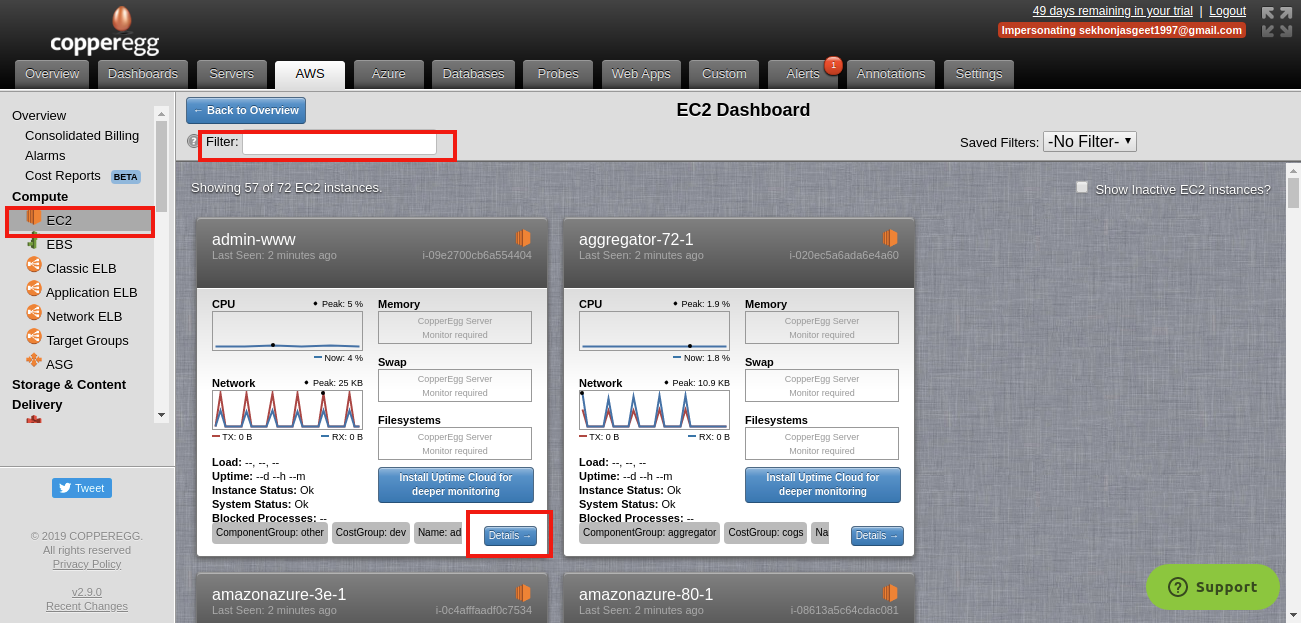
Figure 11:EC2 Instances in AWS account
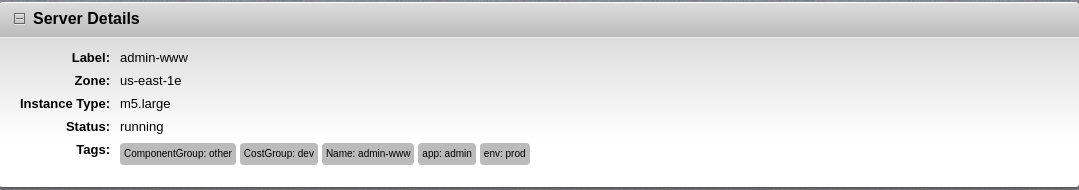
Figure 11(a):EC2 InstanceServer Details
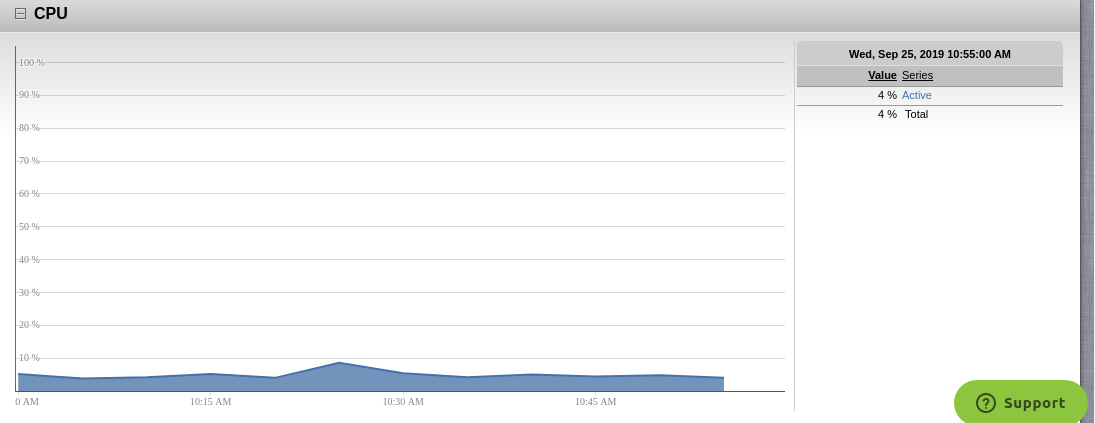
Figure 11(b):CPU monitoring of EC2 Instance
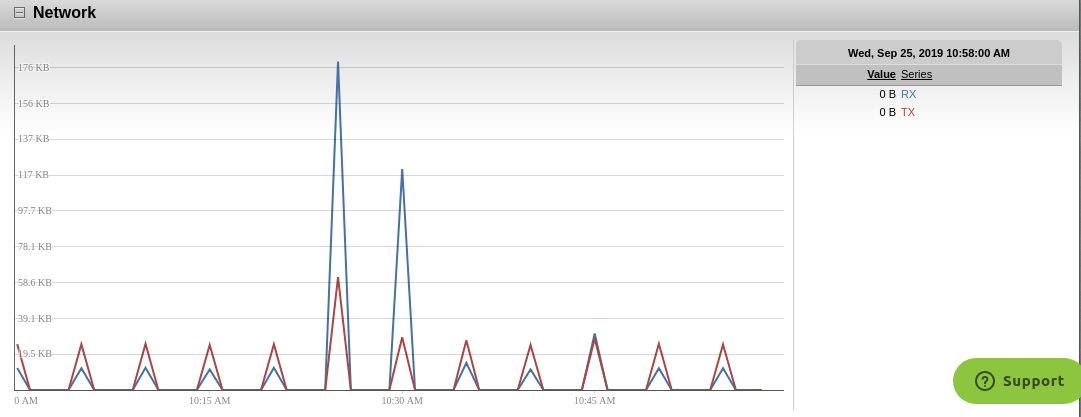
Figure 11(c):Network monitoring of EC2 Instance
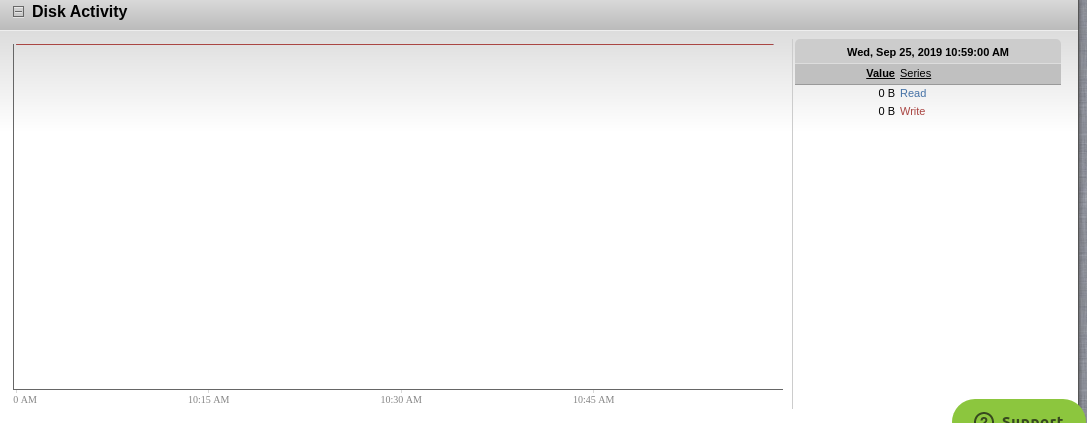
Figure 11(d):Disk Activity monitoring of EC2 Instance
-
- EBS
- Shows EBS volumes of your AWS account..
- Apply Filter to see particular volumes
- Click on Details to get more information about each volume’s
- Volume Details
- Instance to which the volume is attached to.
- ELB details
- Volume Read/Write Bytes
- Volume Read/Write operations
- Volume total Read/Write/Idle Time
- Volume Queue Length
- EBS
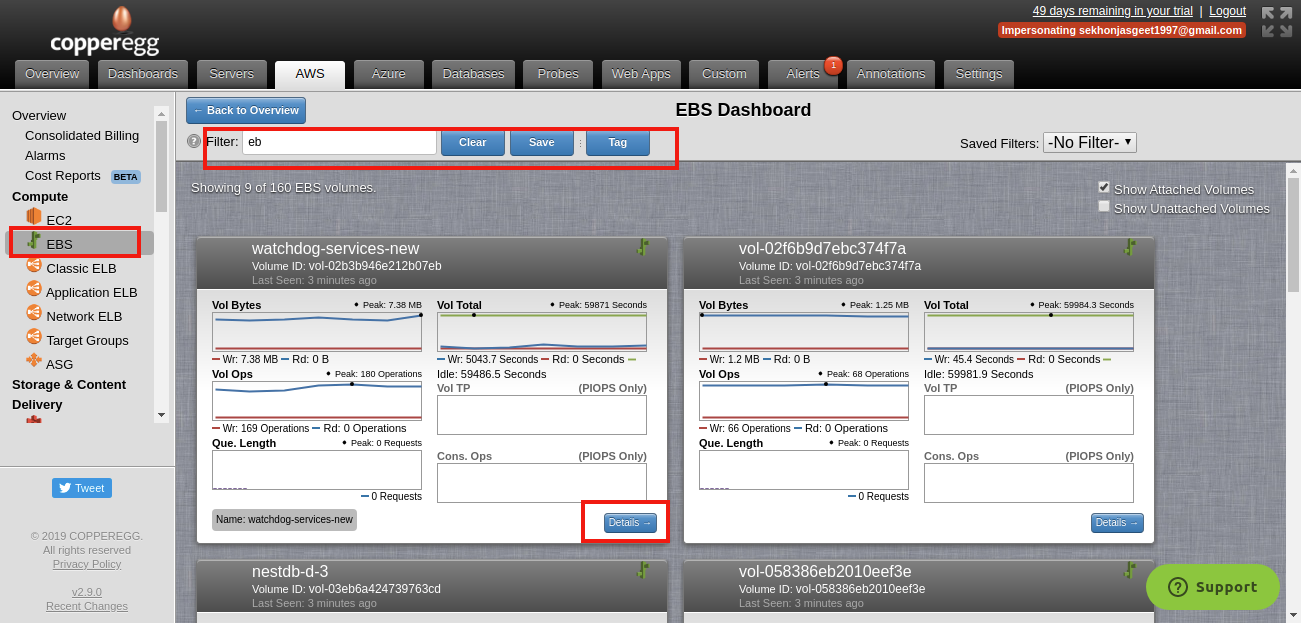
Figure 12:EBS volumes in AWS account
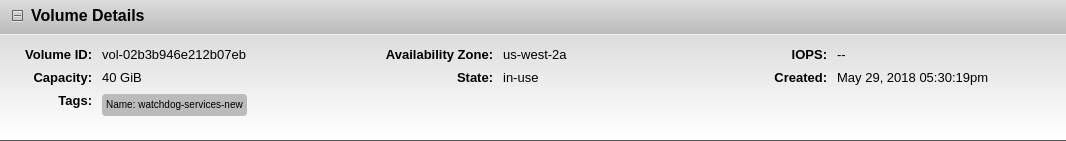
Figure 12(a): Volume Details

Figure 12(b):Instance Details of EBS Volume
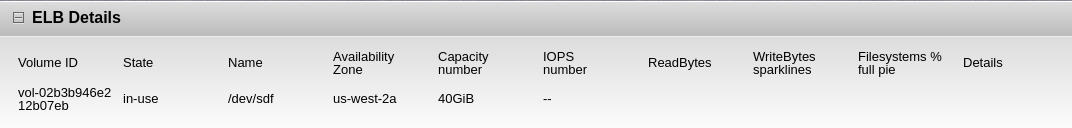
Figure 12(c):ELB Details
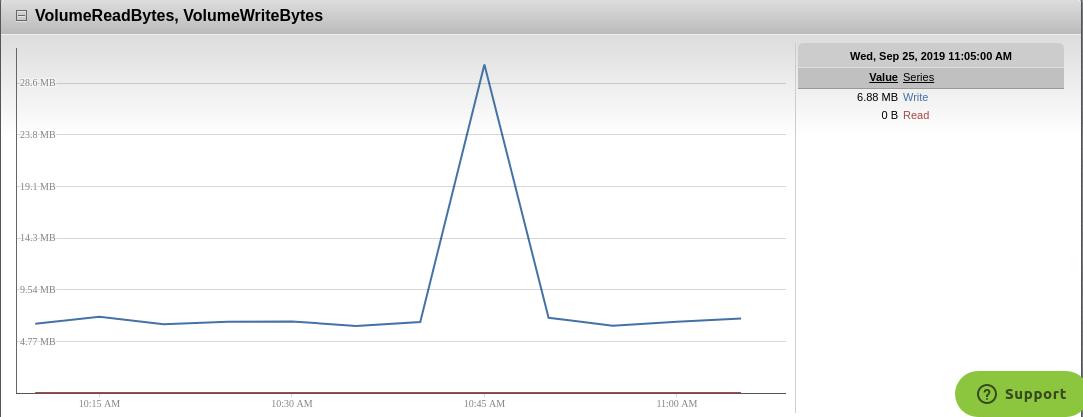
Figure 12(d):Volume Read/Write Bytes
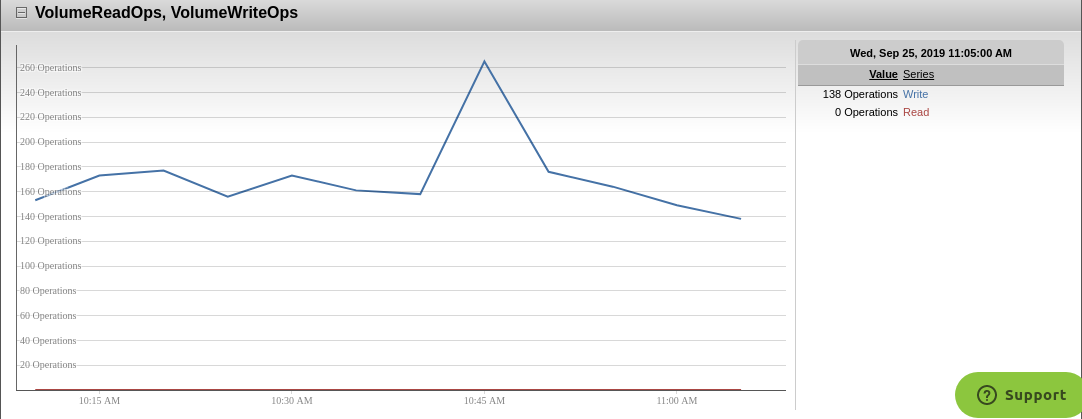 Figure 12(e):Volume Read/Write Operations
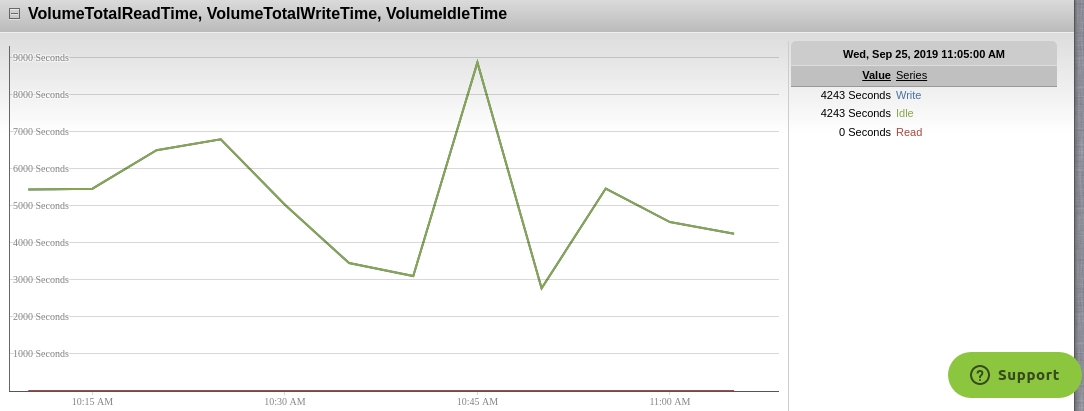
Figure 12(f):Volume Total Read/Write/Idle Time
-
- Classic ELB
- Shows Classic ELBs of your account.
- Apply Filter to see particular ELBs
- Click on Details to get more information about each ELB’s
- Dimension Details
- Healthy and Unhealthy host count
- Spillover Count
- Surge Queue
- Latency Time
- Backend Connection Errors and more
- Classic ELB
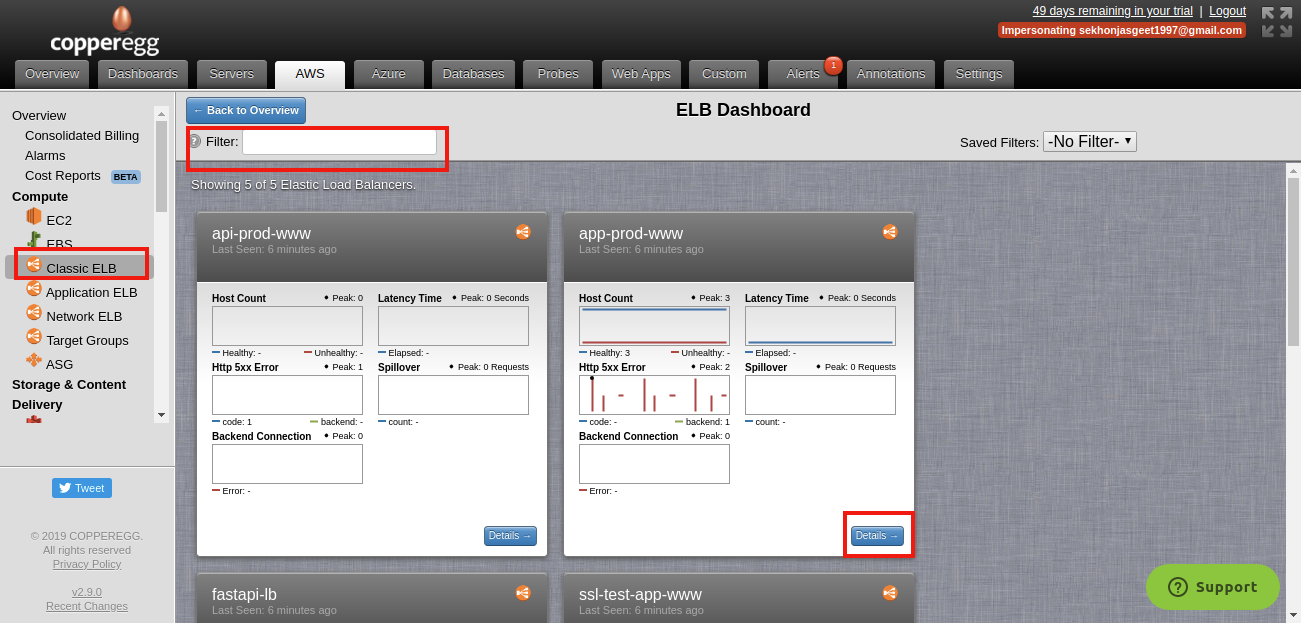
Figure 13:Classic ELBs in AWS account
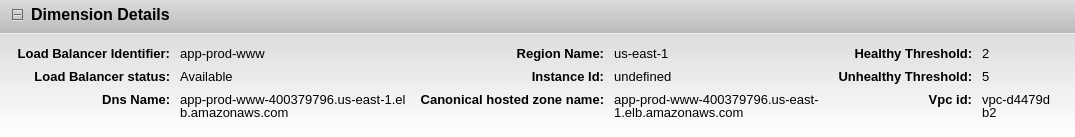
Figure 13(a):Classic ELBs Dimension Details
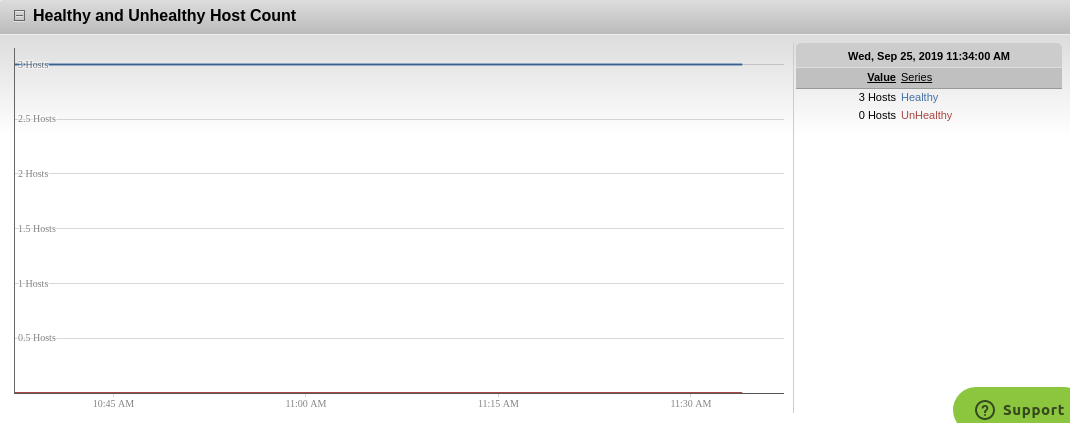
Figure 13(b):Healthy and Unhealthy Host Count
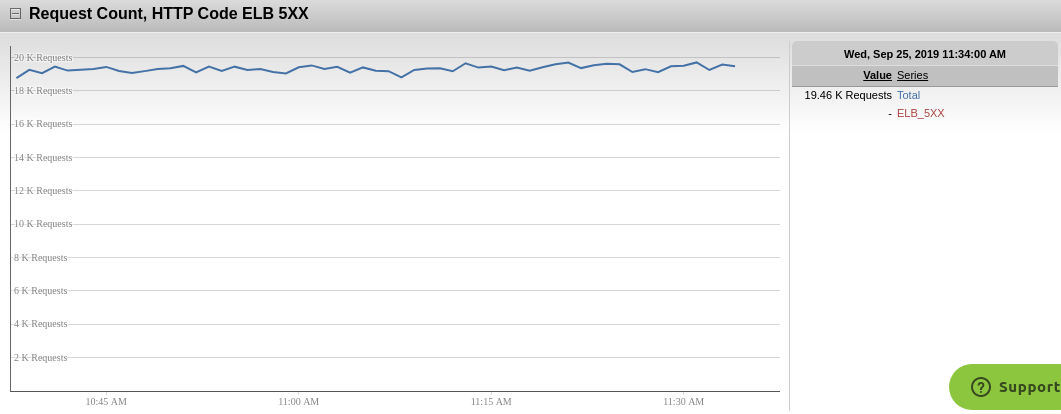
Figure 13(c):Request Count,HTTP Code ELB 5XX
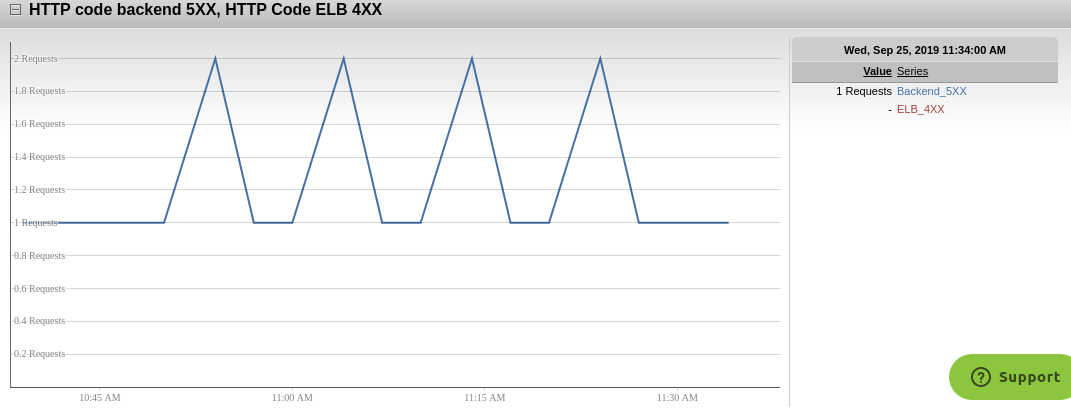 Figure 13(d):HTTP code backend 5XX, HTTP code ELB 4XX
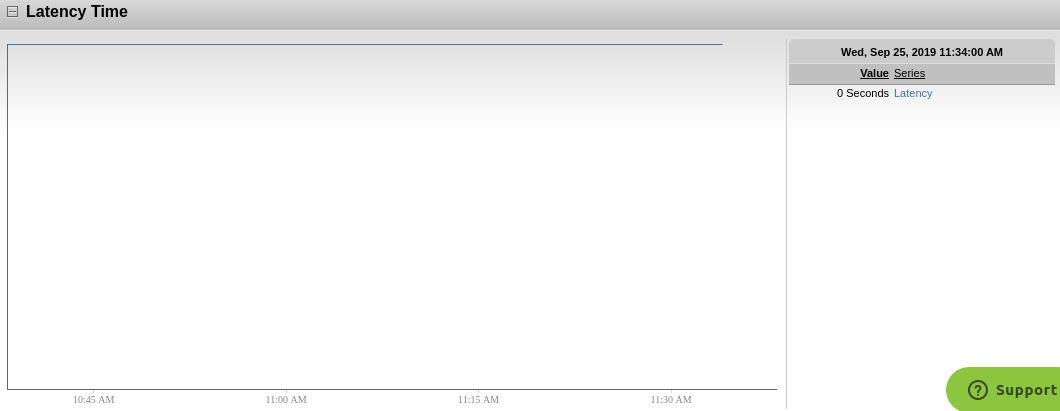 Figure 13(e): ELBs Latency Time
-
- Application ELB
- Shows Application ELBs of your account.
- Apply Filter to see particular ELBs.
- Click on Details to get more information about each ELB’s
- Dimension Details
- Target Connection Error Count
- Consumed LCU
- IPv6 process bytes
- IPv6 request count
- Connections
- Processed Bytes and more
- Application ELB
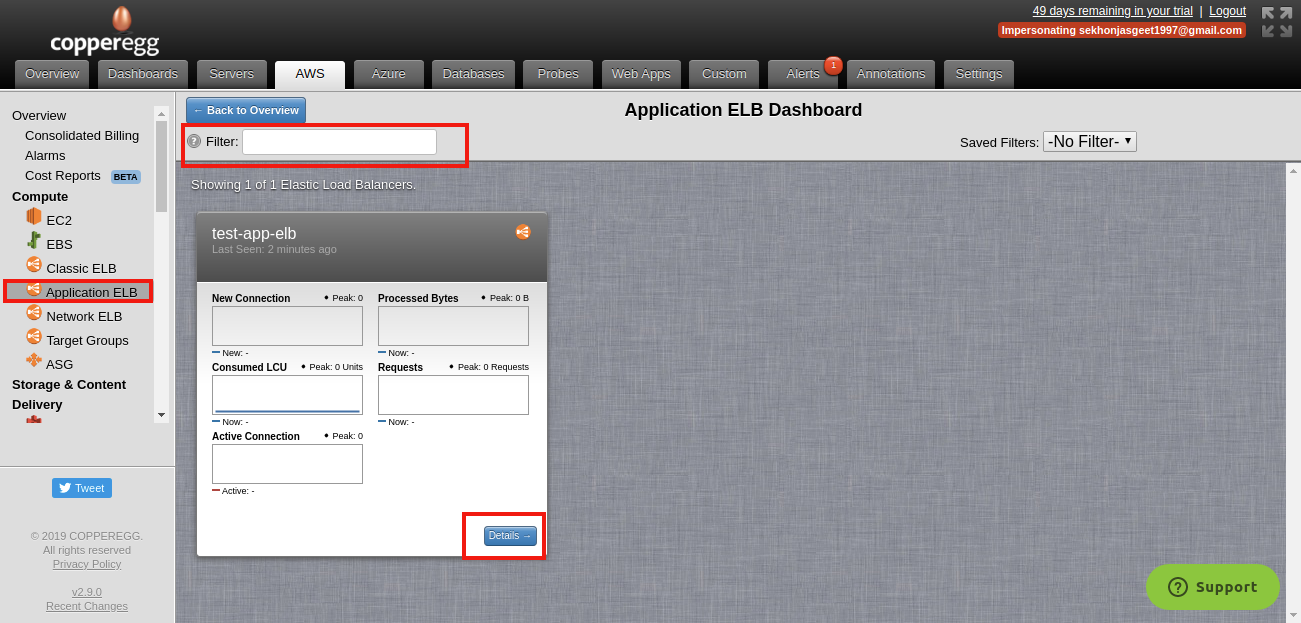
Figure 14:Application ELBs in AWS account
-
- Network ELB
- Shows Network ELBs of your account.
- Apply Filter to see particular ELBs.
- Click on Details to get more information about each ELB’s
- Dimension Details
- Processed Bytes
- Flow Count
- Client, ELB, Target reset counts
- Consumed LCU
- Network ELB
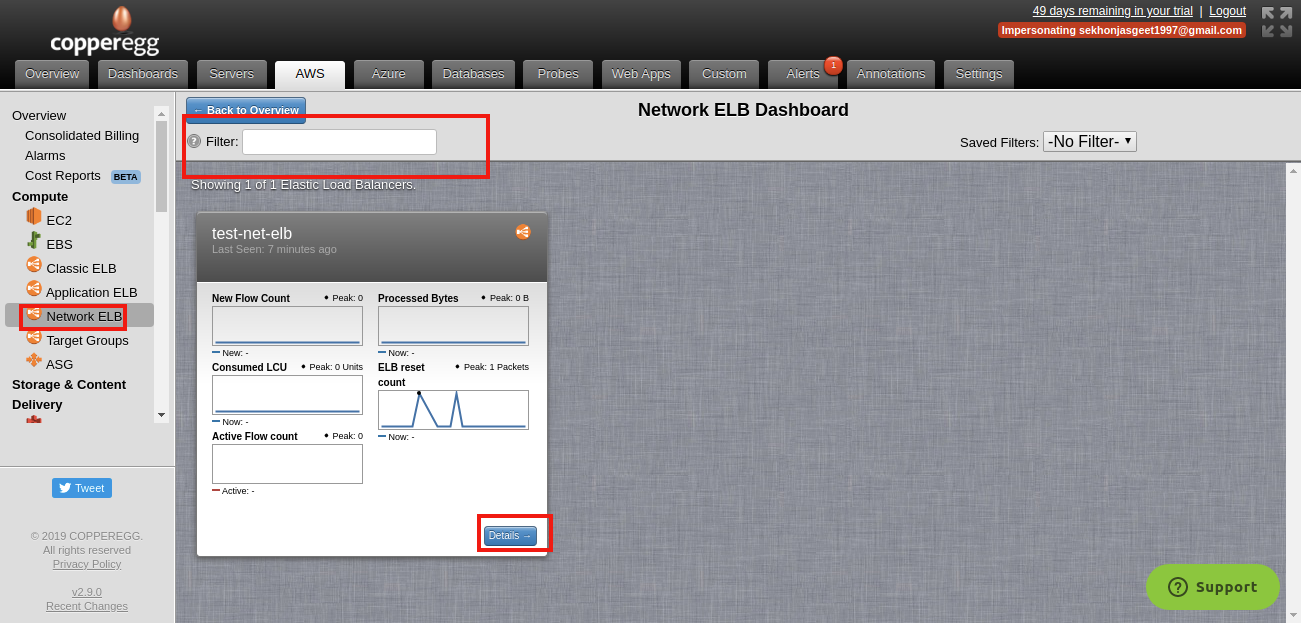
Figure 15:Network ELBs in AWS account
-
- Cloudfront-
- Shows your Cloudfront nodes.
- Apply Filter to see particular nodes.
- Click on Details to get more information about each cloudfront node
- Request
- 4XX errors
- Bytes Downloaded
- Bytes Uploaded and more
- Cloudfront-
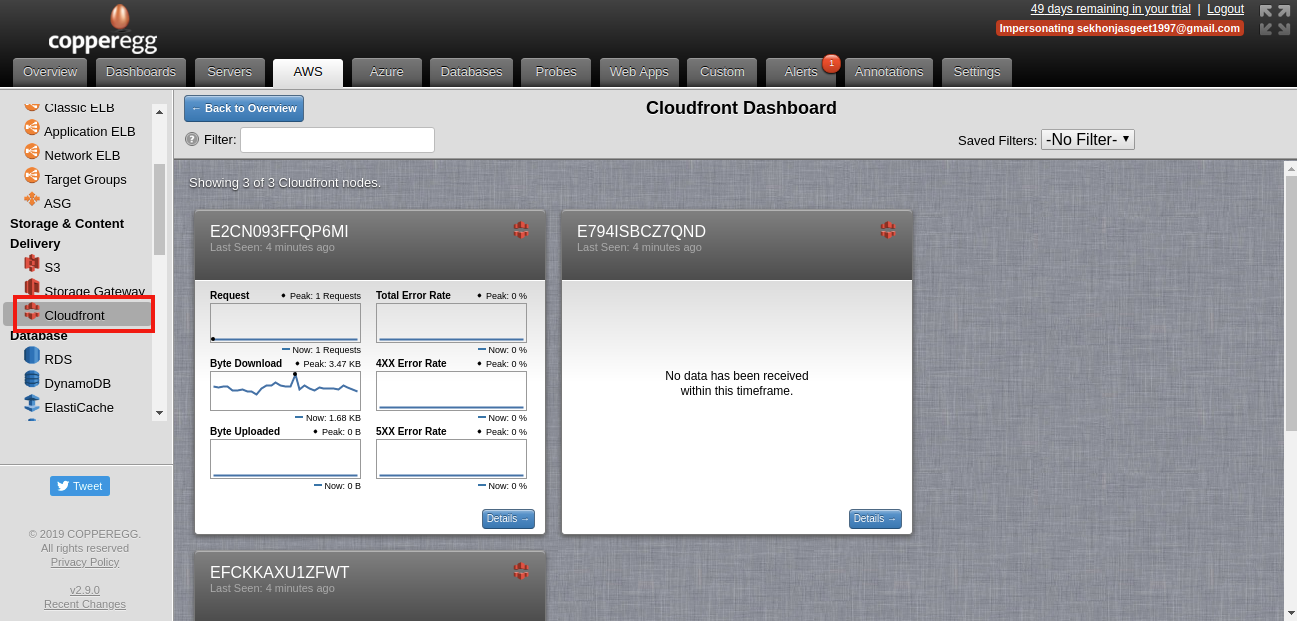
Figure 16:Cloudfront nodes
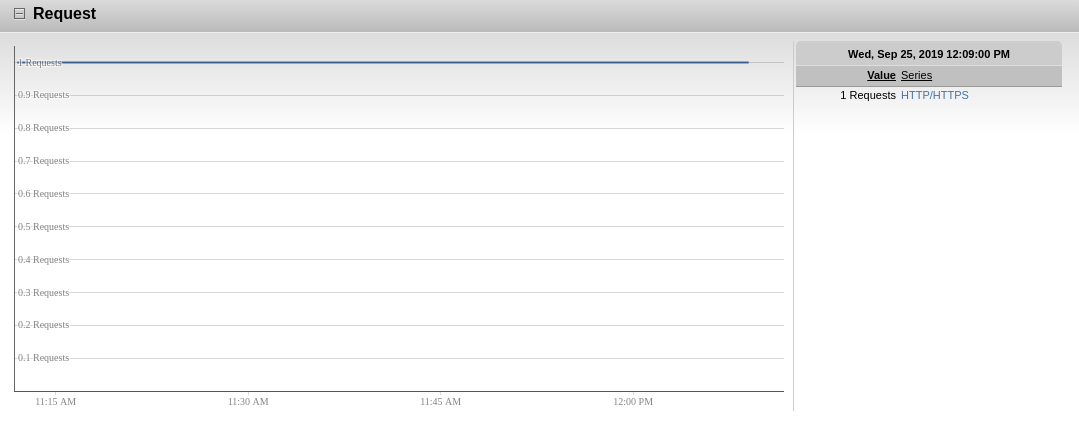
Figure 16(a):Requests
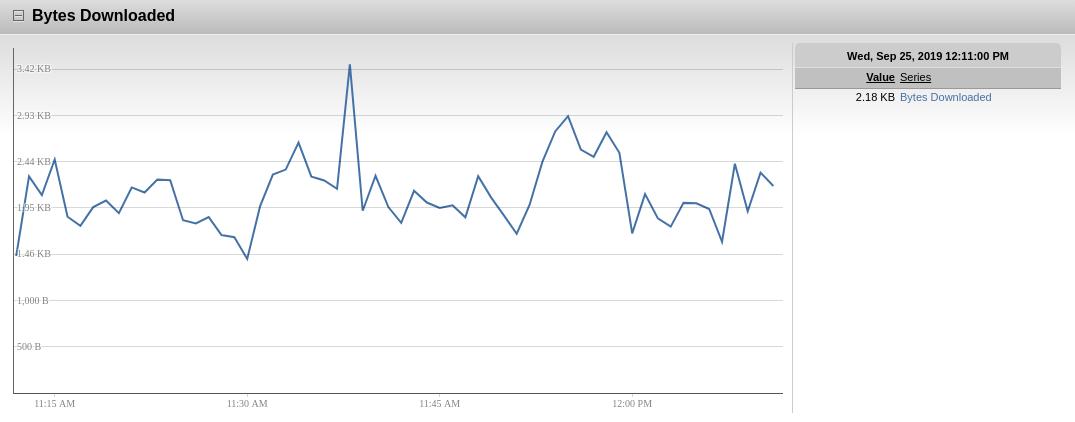
Figure 16(b):Bytes Downloaded using Cloudfront
-
- RDS-
- Shows details of RDS databases in AWS account
- Apply Filter to see particular nodes.
- Click on Details to get more information about each database
- Binary Logs Disk Usage
- CPU utilization
- Database connection
- Freeable memory
- Free Storage Space
- Latency
- Disk I/O operations
- Disk Throughput
- Network Throughput and more
- RDS-
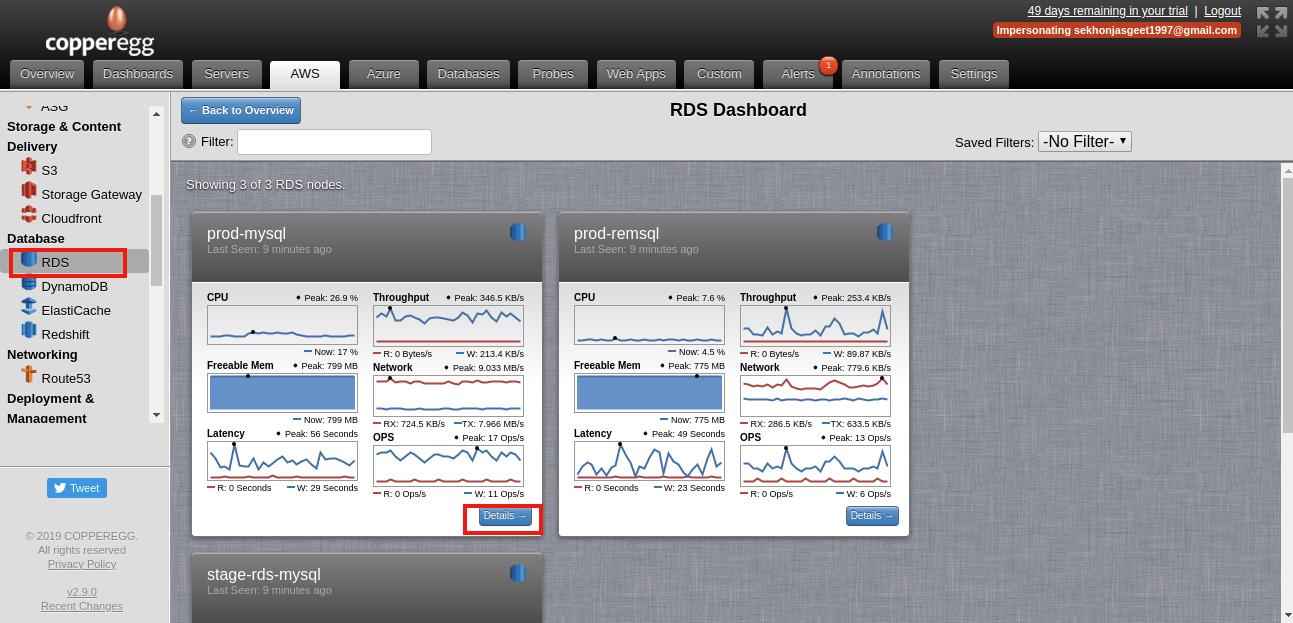
Figure17:RDS database for AWS Account
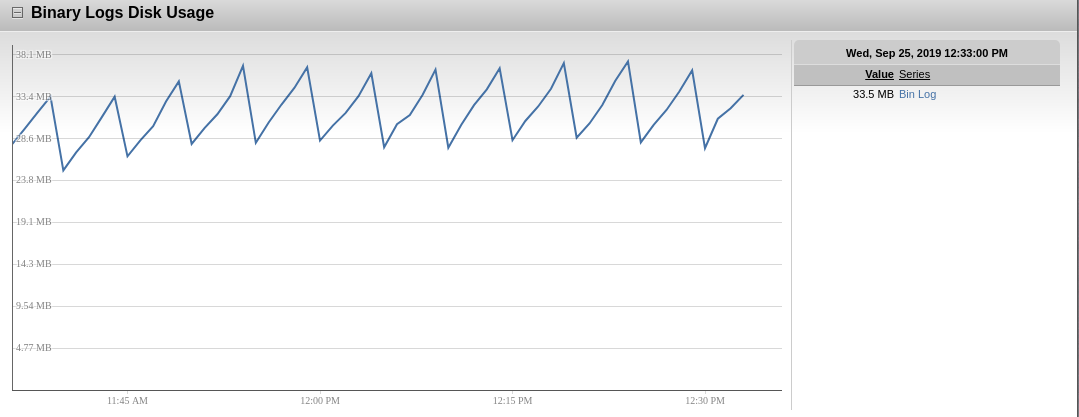
Figure17(a): Binary Logs for Disk Usage
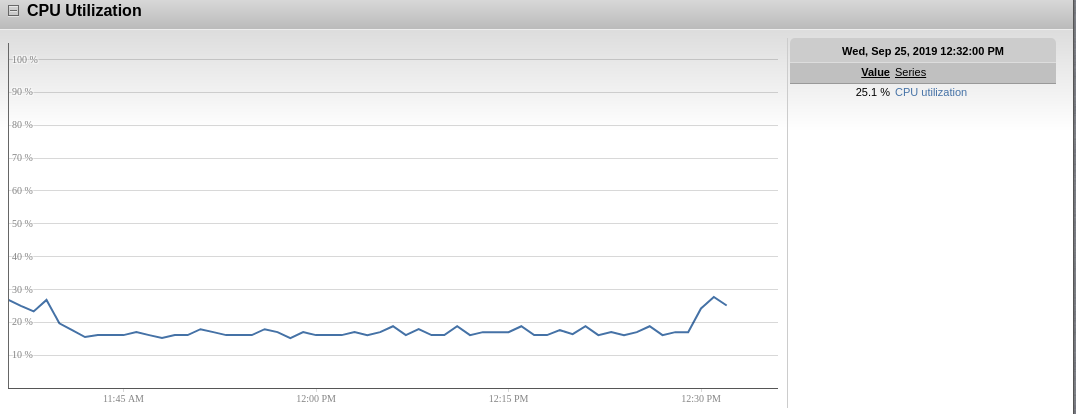
Figure17(b) :CPU Utilization
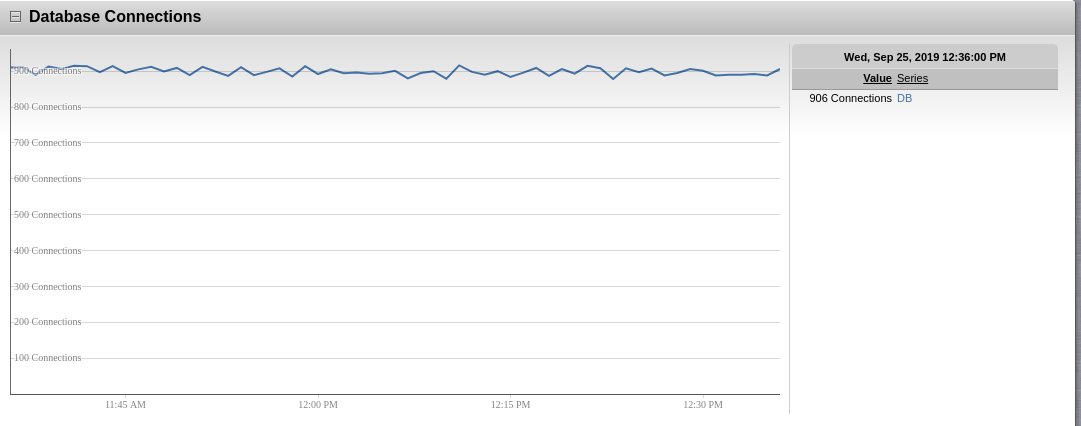 Figure17(c): Database Connections
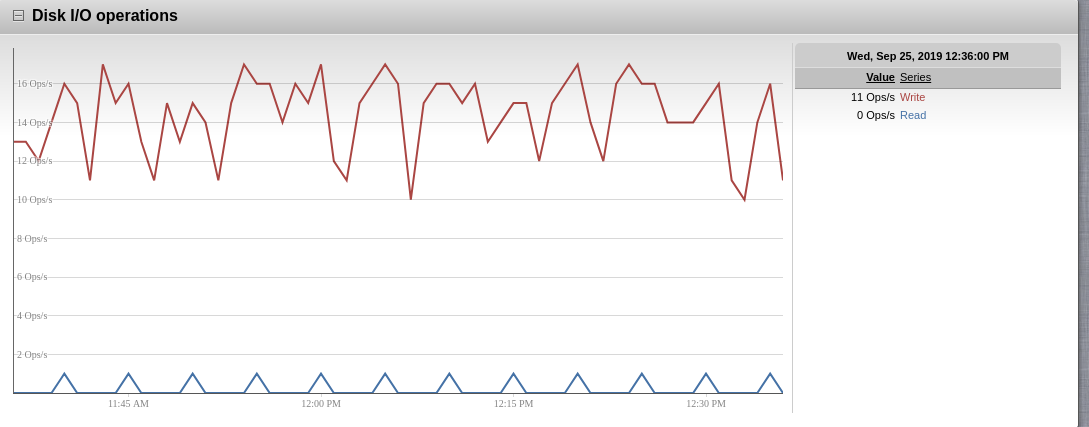 Figure17(d): Disk I/O Operations
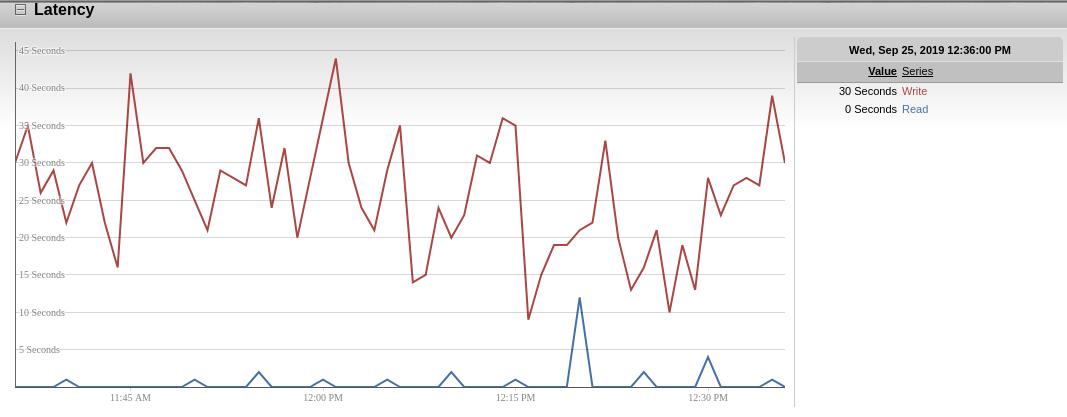 Figure17(e) Latency
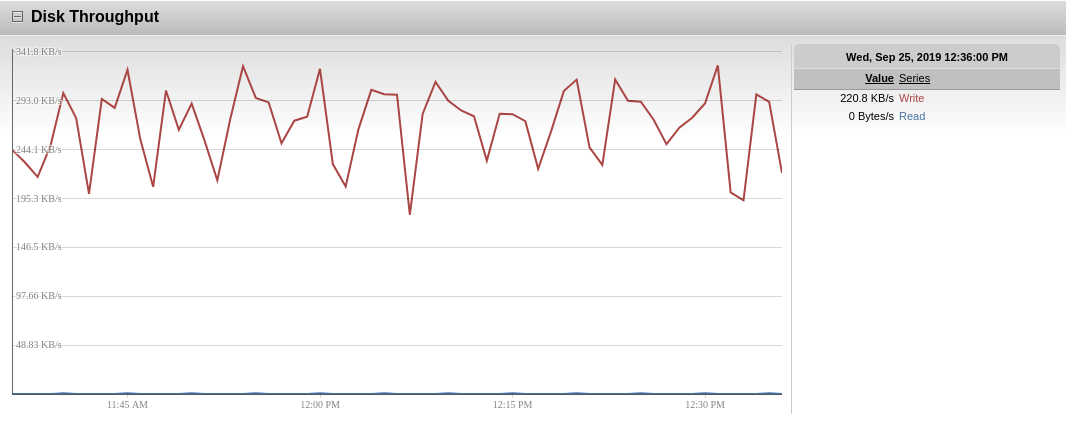 Figure17(f) :Disk Throughput
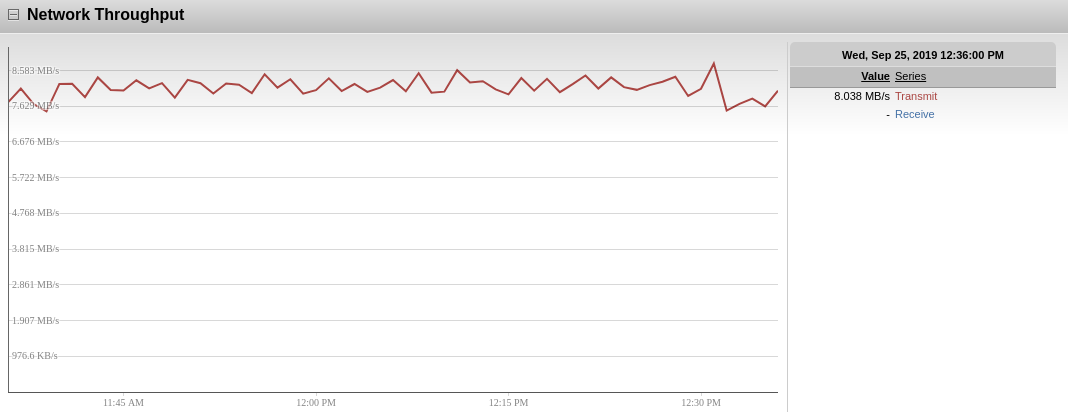 Figure17(g):Network Throughput
-
- Elastic Cache-
- Shows details of elastic cache nodes in AWS
- Apply Filter to see particular cache.
- Click on Details to get more information on-
- Current and new connections
- Bytes used for cache items
- Cache hits/misses
- Current items and more
- Elastic Cache-
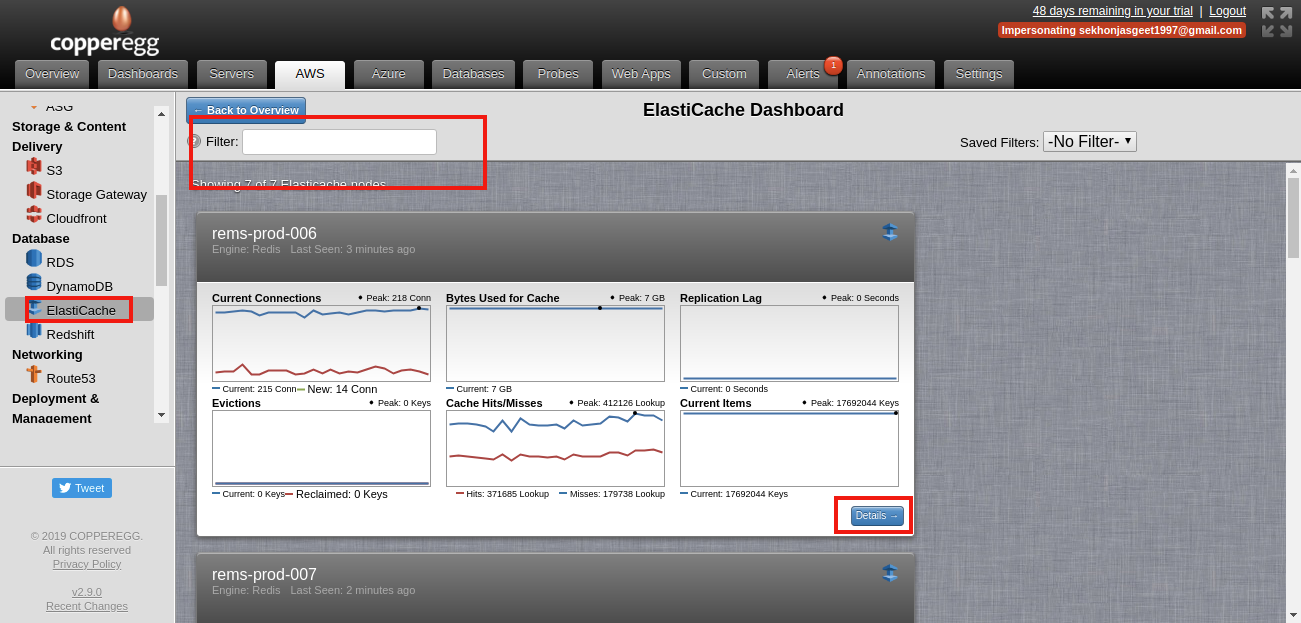
Figure 18: Monitoring Elastic Caches in AWS Account
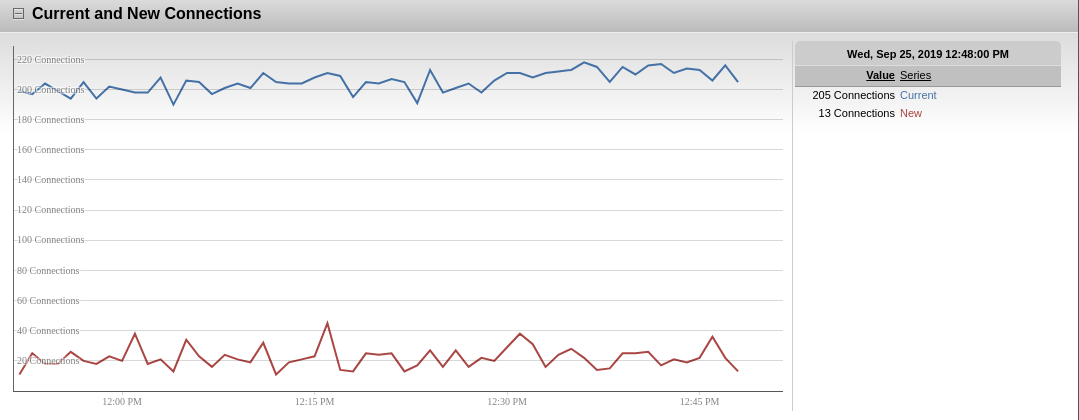
Figure 18(a):Current and New Connections
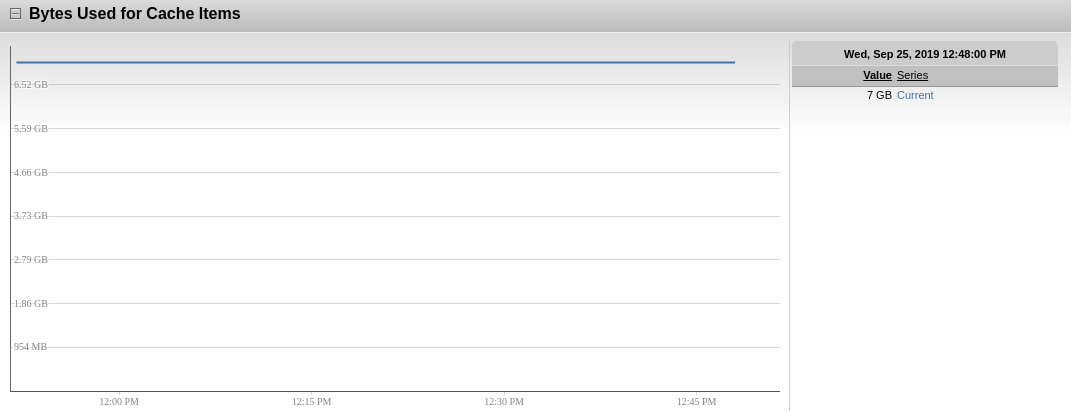
Figure 18(b): Bytes used for cache items
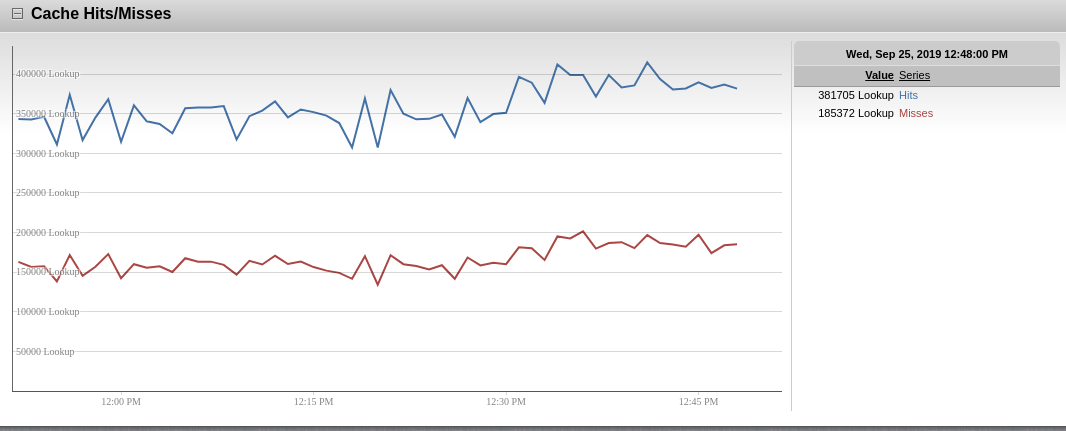
Figure 18(c): Cache hits/misses
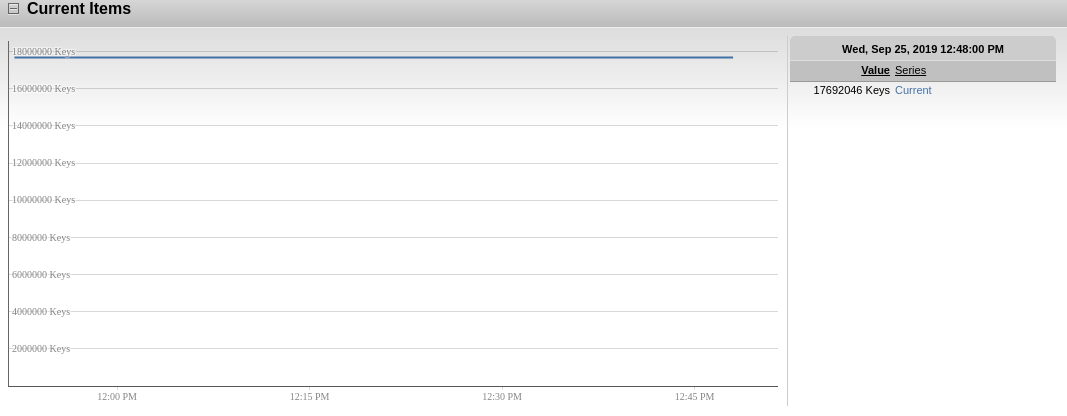 Figure 18(d):Current Items
-
- Route53-
- Shows Route53 nodes of your account
- Apply Filter to see particular Route53.
- Click on Details to get more information about-
- Health Percentage
- Health Check
- Route53-
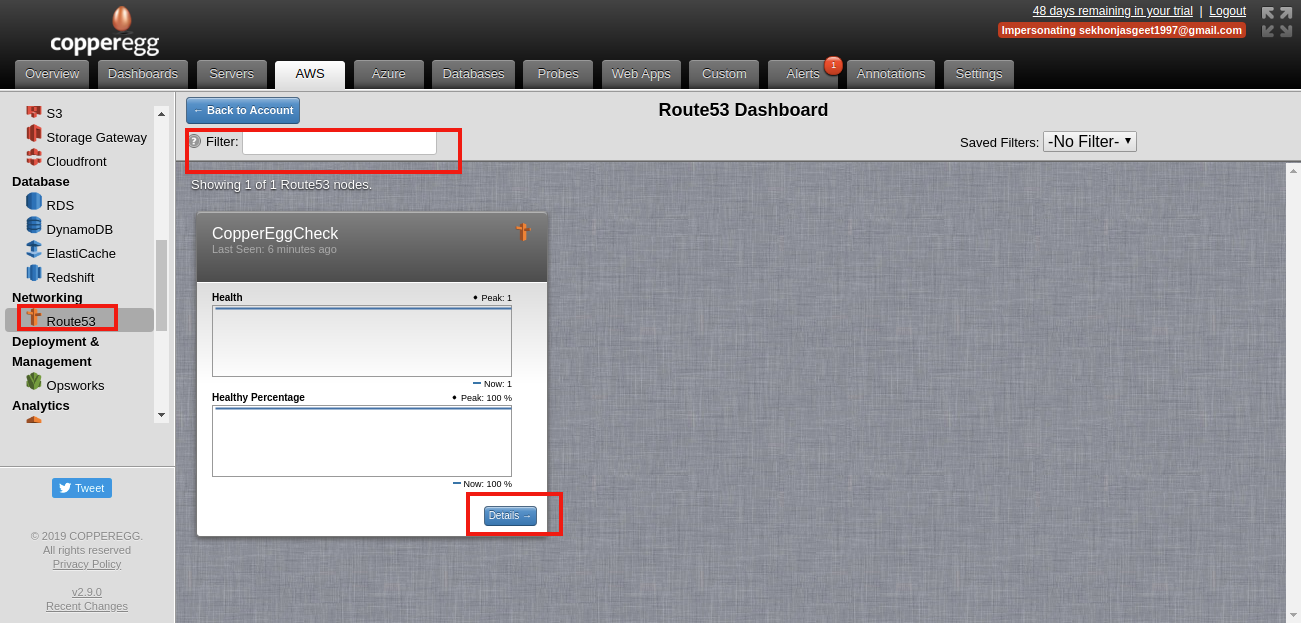
Figure 19: AWS Route53
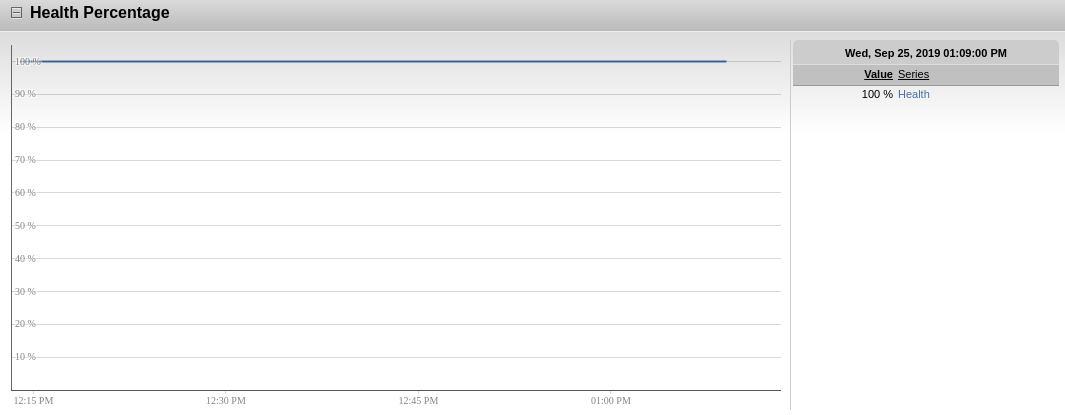
Figure 19(a):Health Percentage
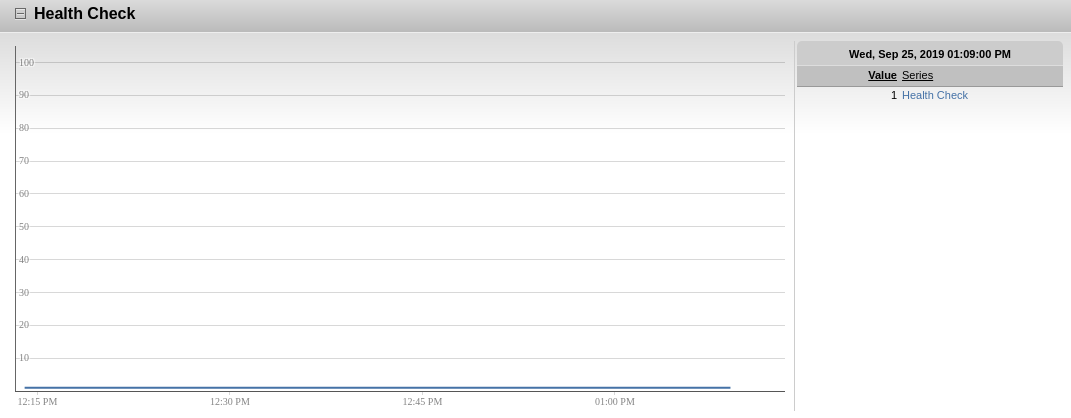 Figure 19(b):Health Check
-
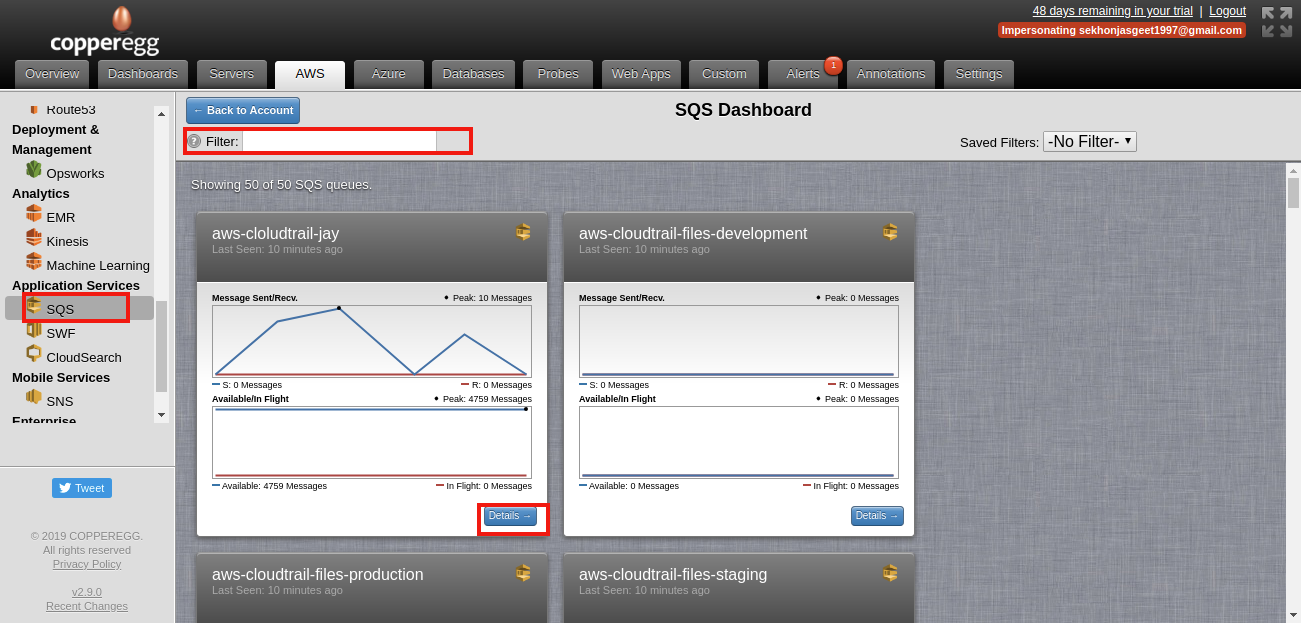
- SQS(Simple Queue Service)-
- Shows queues of your account
- Apply Filter to see particular queue.
- Click on Details to get more information about-
- Messages sent/received
- Empty messages received
- Messages deleted
- Message size and more .
- SQS(Simple Queue Service)-
Figure 20: SQS queues in AWS
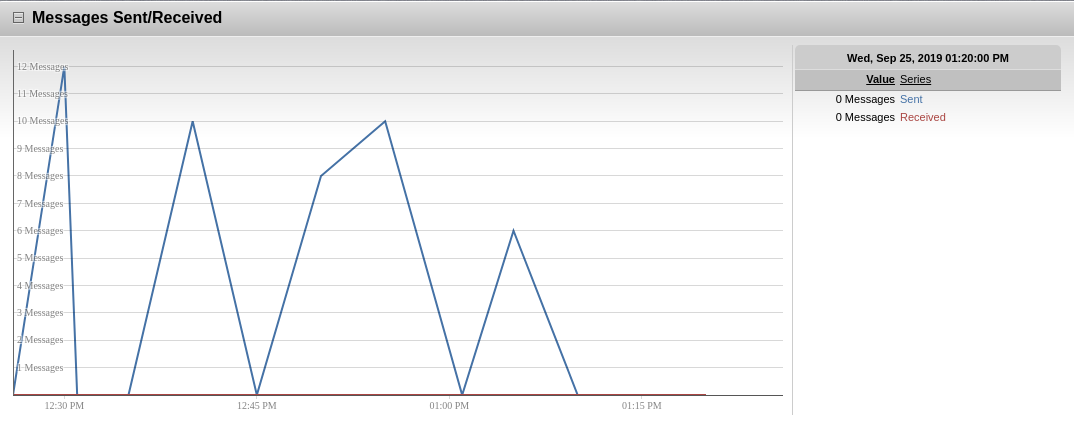
Figure 20(a):Messages Sent/Received
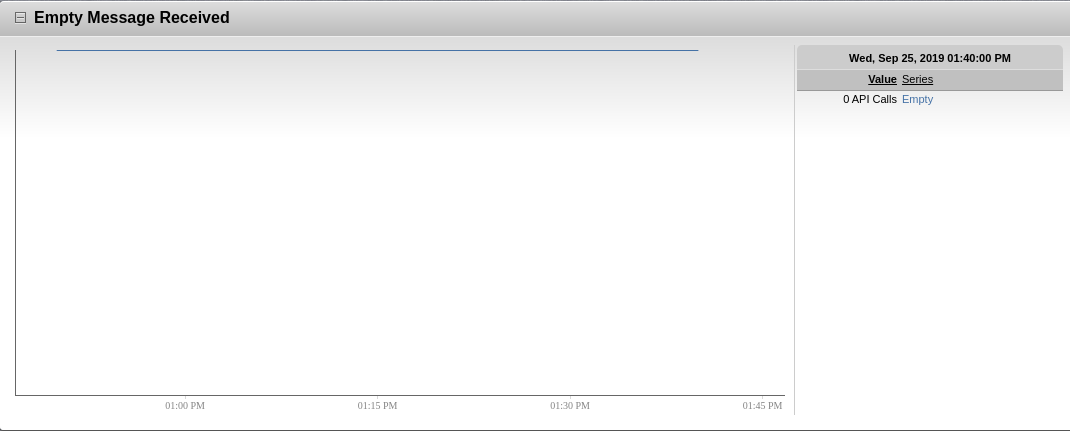
Figure 20(b):Empty messages received
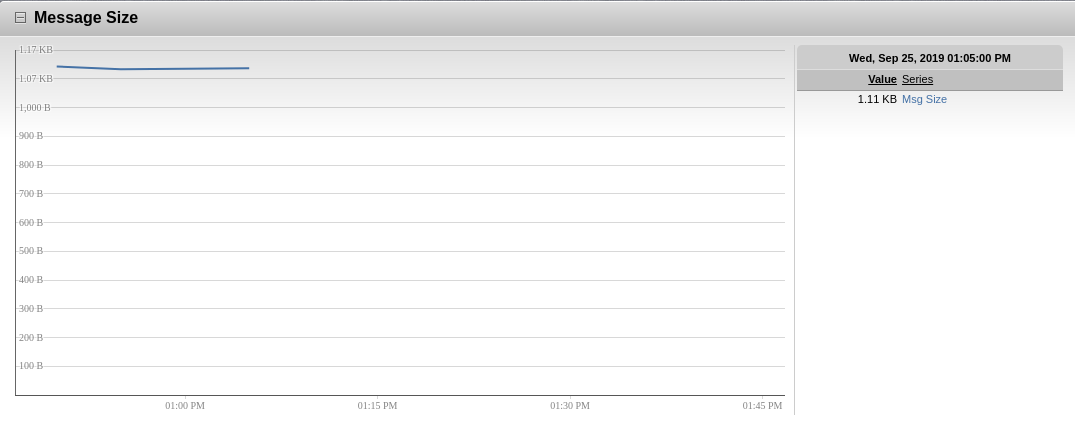
Figure 20(c):Message Size
Step 3: Configure Alerts
Alerts are basically used to notify when a particular state is reached by the server. Alerts are pre-configured but can also be customized according to one’s needs.
- For configuring Alerts , one can navigate to Alerts tab and then select Configure Alerts from the left panel and then New Alert.
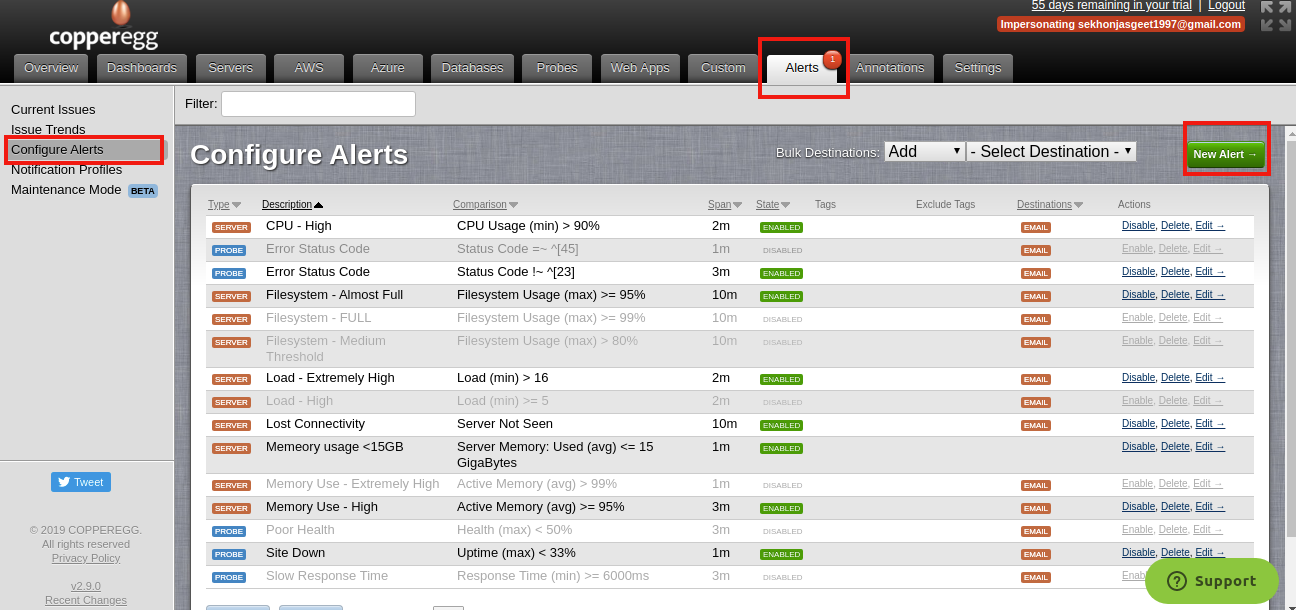
Figure 21: Configuring Alerts
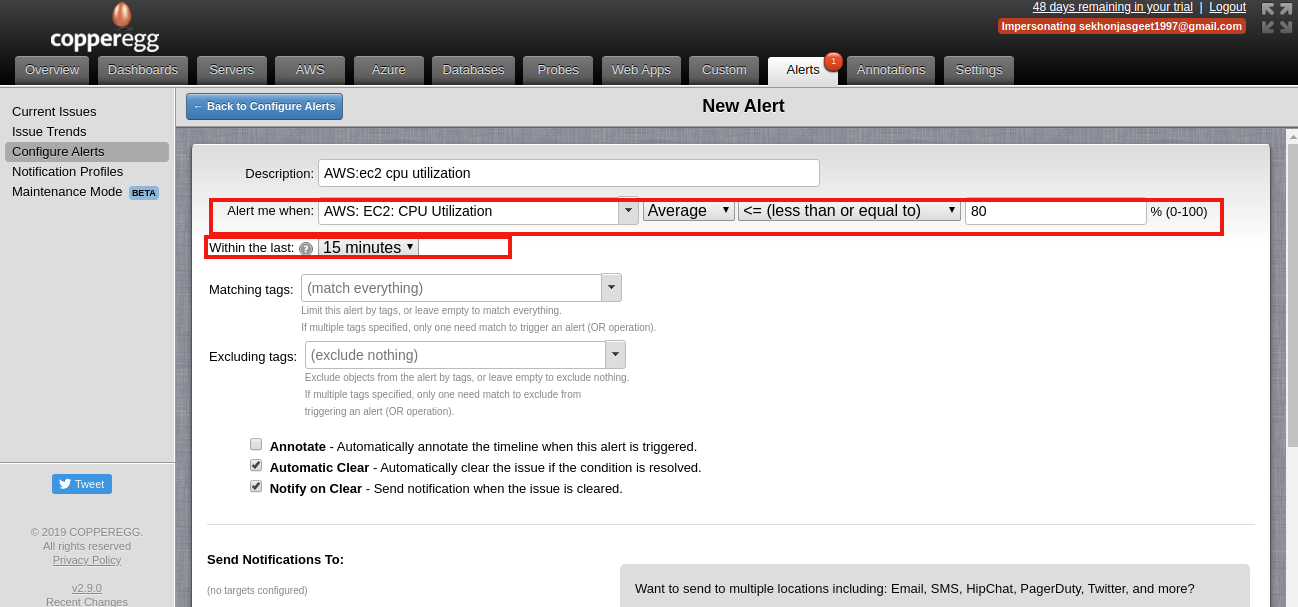
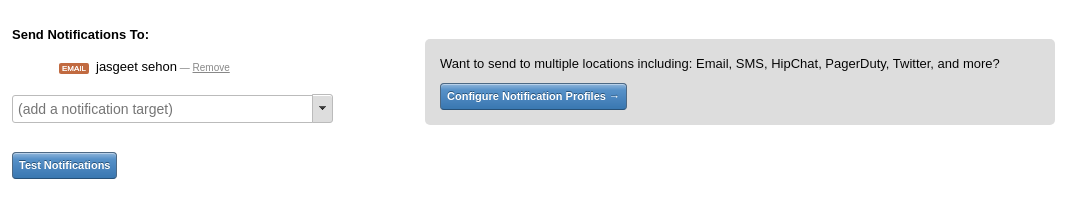
Figure 21(a): UI for configuring alert condition
- Provide values for these fields in the New Alert page:
- Description: A description of the alert that will be easily recognized by you and your team if the alert is triggered.
- Alert me when: Select the metric of interest and the condition upon which the alert is triggered.
- For at least: The duration for which the alert condition must be valid for the alert to be triggered
- Matching tags: By default, (match everything) is chosen. If needed, you can attach tags to a particular metric object and select those tags here, which would cause only alerts on that metric object to be triggered.
- Excluding tags: By default, (exclude nothing) is chosen. If needed, you can attach tags to a particular metric object and select those tags here, which would cause alerts on that metric object to be skipped.
- Annotate: When enabled, an annotation is automatically created when the alert is triggered. Annotations will be visible in the custom metrics dashboard where the data stream is displayed.
- Automatic Clear: When enabled, the alert issue is automatically cleared if the triggering condition is no longer true
- Notify on clear: When enabled, notifications are also sent when the alert issue is cleared. Please do note that notifications are always sent when the alert issue is triggered.
- Send Notifications To: Here you can configure the notification mechanisms by which the alert is communicated to you and others in your team.
CopperEgg supports notifying different sets of users with differing notification mechanisms for each alert type.
Notification mechanisms include:
- SMS
- PagerDuty
- HipChat
- Campfire
- Slack
- OpsGenie
Webhooks are also exposed for clients to configure custom notification mechanisms.
CopperEgg Free Trial! Sign up today!
Sign up for a 14 day FREE TRIAL of CopperEgg (no Credit Card required).
You can find more information about CopperEgg pricing options here.
We charge only $8 per month per standard server and $16 per month per detailed server.Sign up today!