If you want to monitor a Probe CopperEgg provides an easy and efficient way to test a probe. Along with various types of protocols that CopperEgg support you can also select specific regions in which you want to monitor your probe. You can monitor your probe in real-time and get it’s details such as
- Probe’s Uptime
- Response Time
- First-Byte Time
- Health and more
The types of protocol supported for probe monitoring include
- HTTP/HTTPS
- TCP
- REST
- ICMP
- DNS
- SSL
This user guide will help you how to setup and monitor a TCP probe using CopperEgg in three simple steps.
- Add a probe to CopperEgg
- Verify probe is added successfully and is running
- Configure alerts to be notified about probe’s state
Step-1: Add probe to CopperEgg
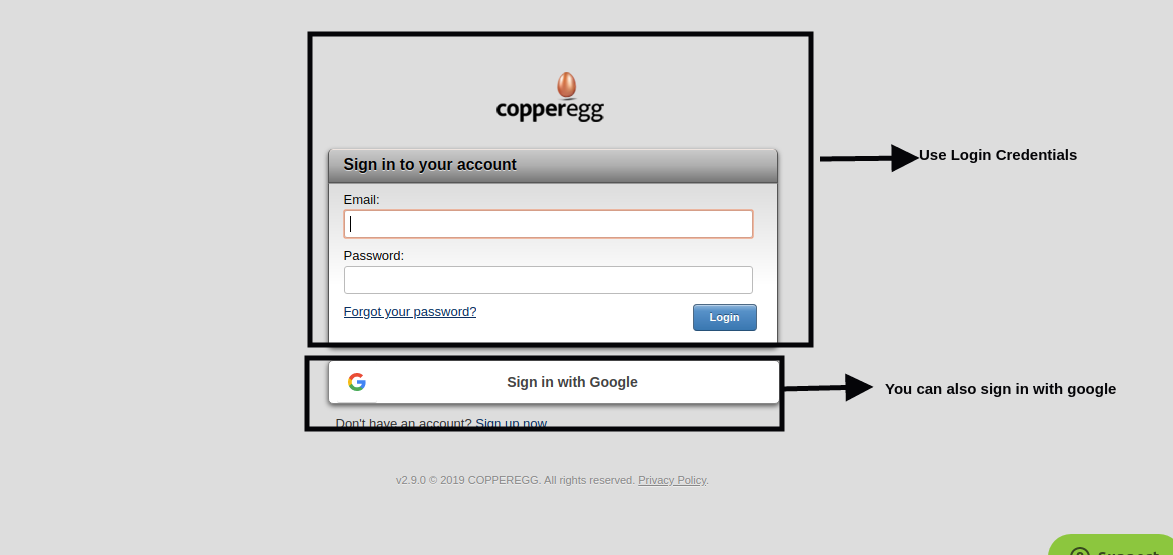
- Sign in to CopperEgg – Use the login credentials you used while signing up or you can also Sign in via Google (New to CopperEgg? You can sign up here)
- Click on Probes and then Add a probe
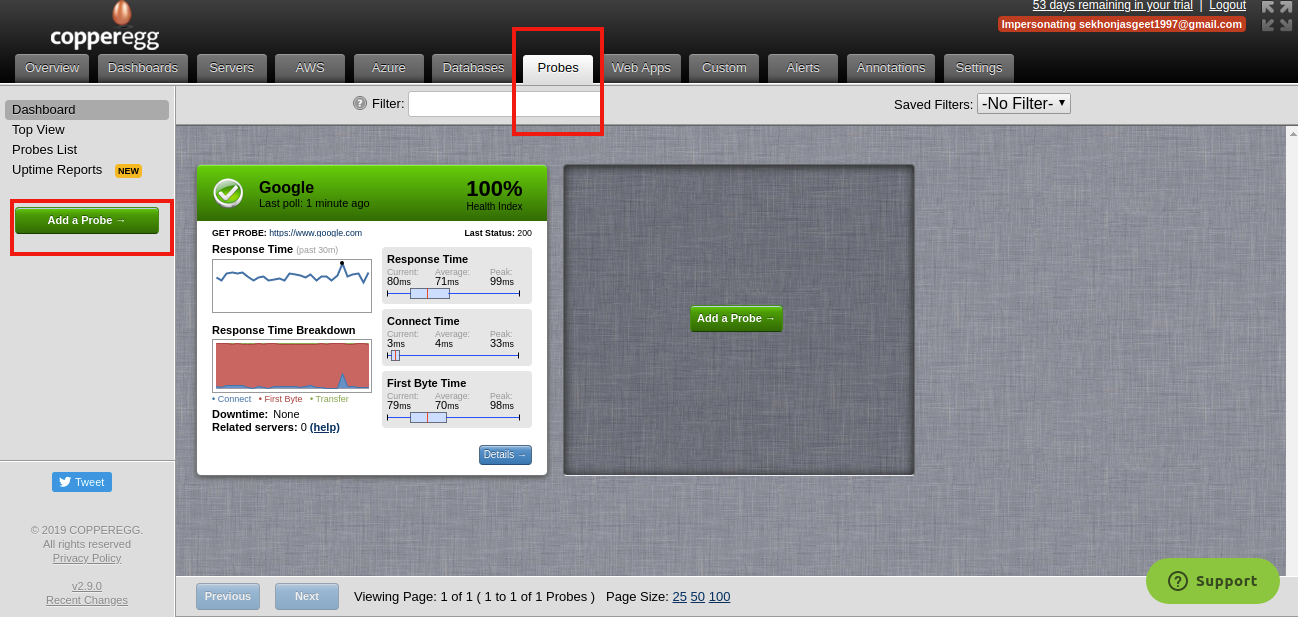
Figure 2: Add a Probe button
- Opt for TCP
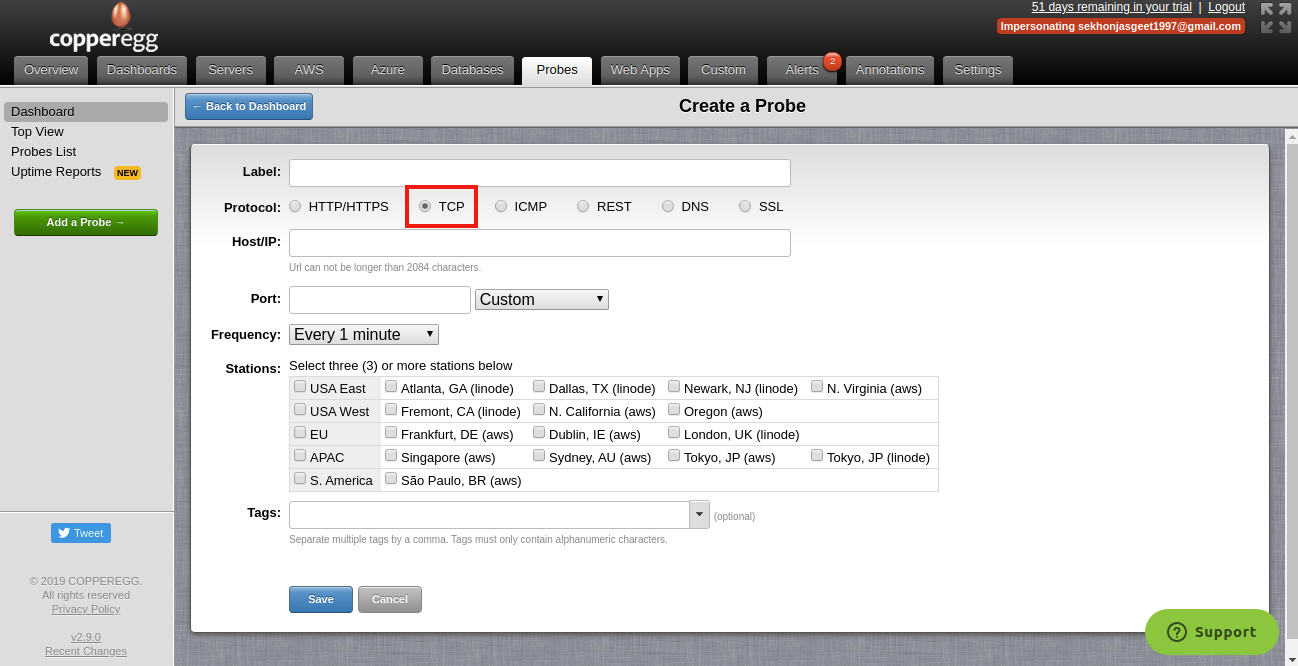
Figure 3: Choose TCP protocol
- Provide these values
- Label- Any name for your probe.
- Host/IP- Provide the Host/IP on network that you want to monitor.
- Port- Provide the port number.
- Frequency- You can choose the frequency at which probe is tested in real-time and the details are updated.
- Stations- Check the station in which you want to monitor your probes(at least 3 stations must be checked)
- Tags (optional field)- You can specify tags related to the probe
- Click on Save
Step-2:Verify probe is added successfully and is running
- Navigate to Probes tab and then to Dashboard, you’ll see that a new Probe has been added .
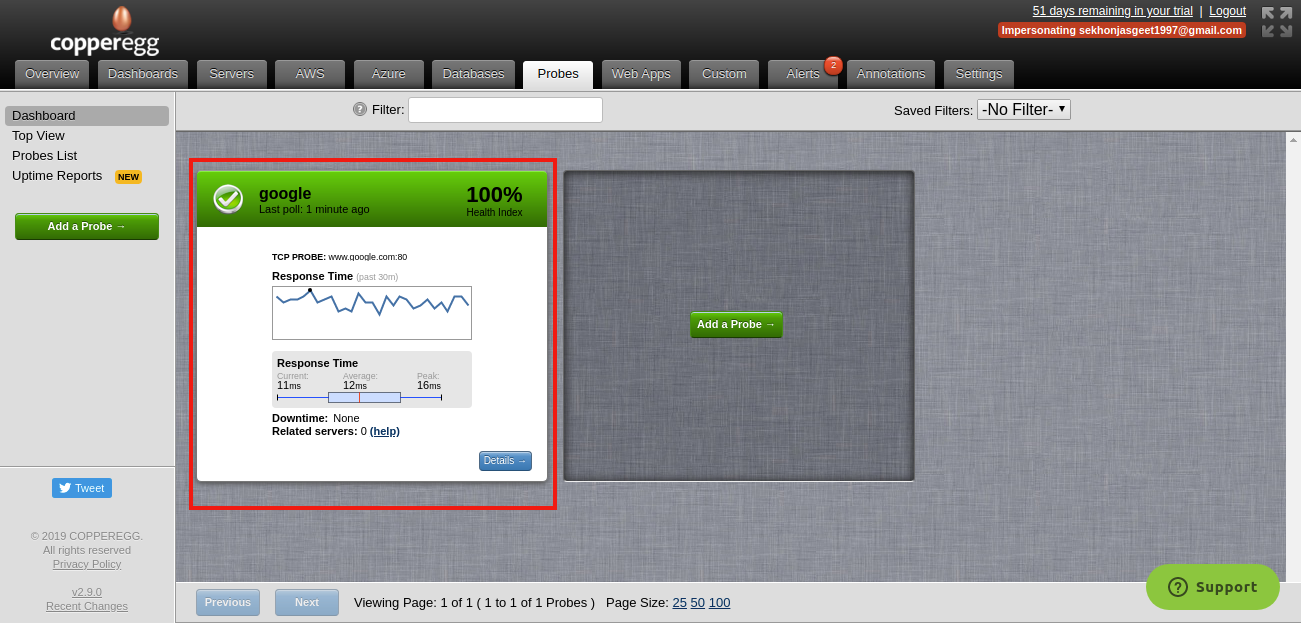
Figure 4: Widget for the new TCP Probe
- Click on Details button to monitor the probe.
1.Section showing Probe Details
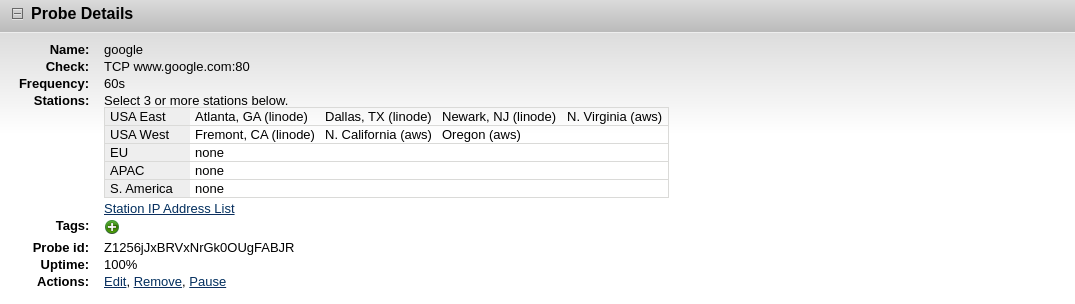
Figure 5: Section of the Details View showing details of the probe
2. Chart showing Response Time
You can go to Details to check Response Time of each region.
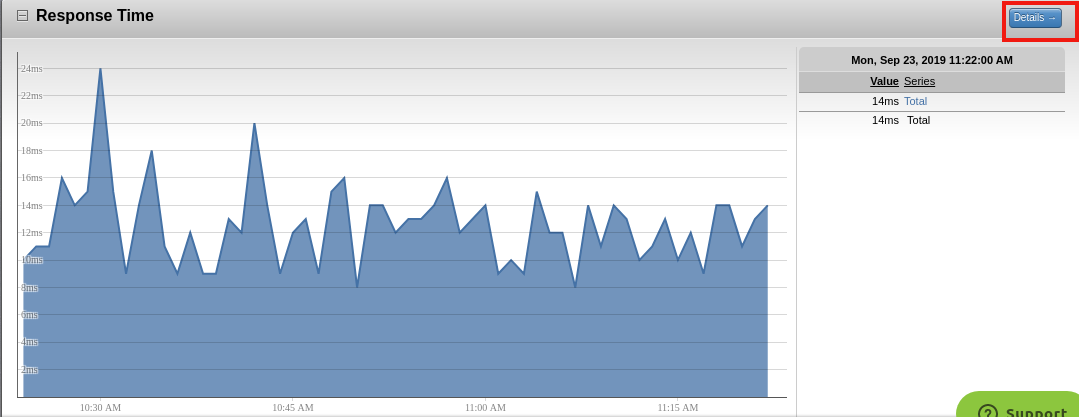
Figure 6: Chart displaying Response Time
3.Chart showing Health of probe.
Go to Details of health particular to each region

Figure 7: Chart displaying Health
4.Chart showing probe Uptime.
You can click on Details to check uptime for each region.
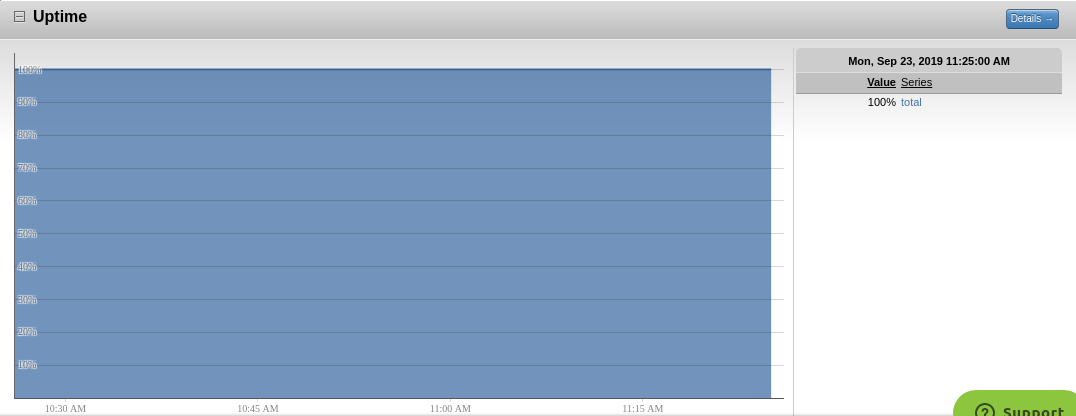
Figure 8: Chart displaying Uptime
Step-3 – Configure Alerts
Alerts are basically used to notify when a particular state is reached by the server. Alerts are pre-configured but can also be customized according to one’s needs.
- For configuring Alerts , one can navigate to Alerts tab and then select Configure Alerts from the left panel and then New Alert.
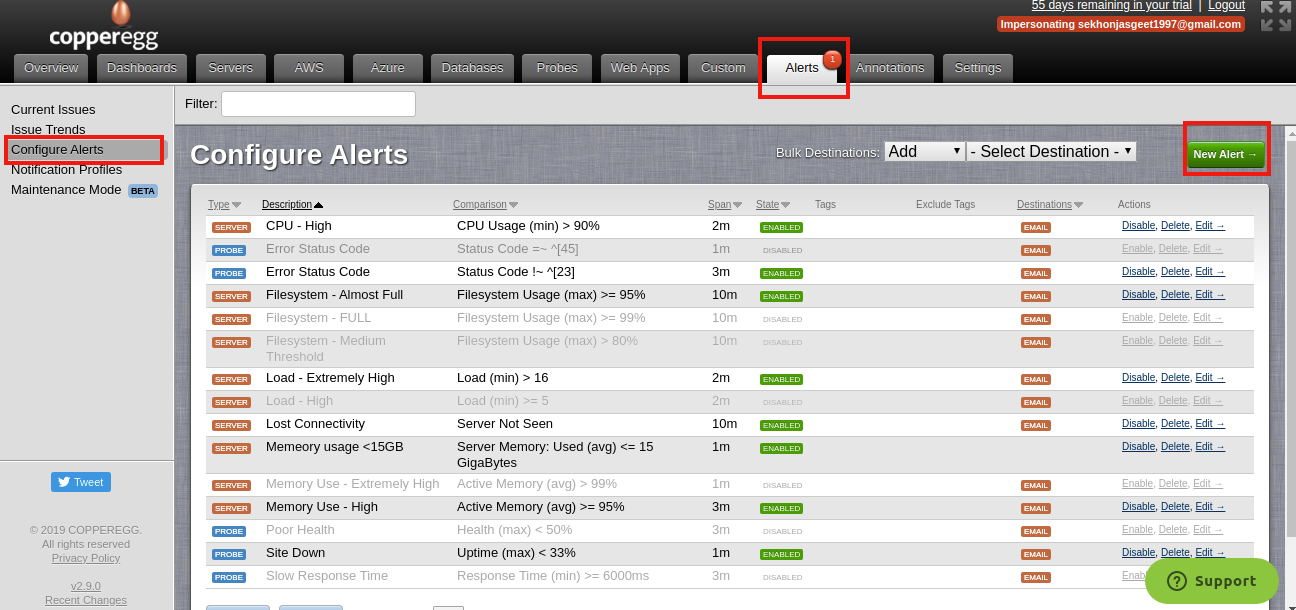
Figure 9: Configuring Alerts
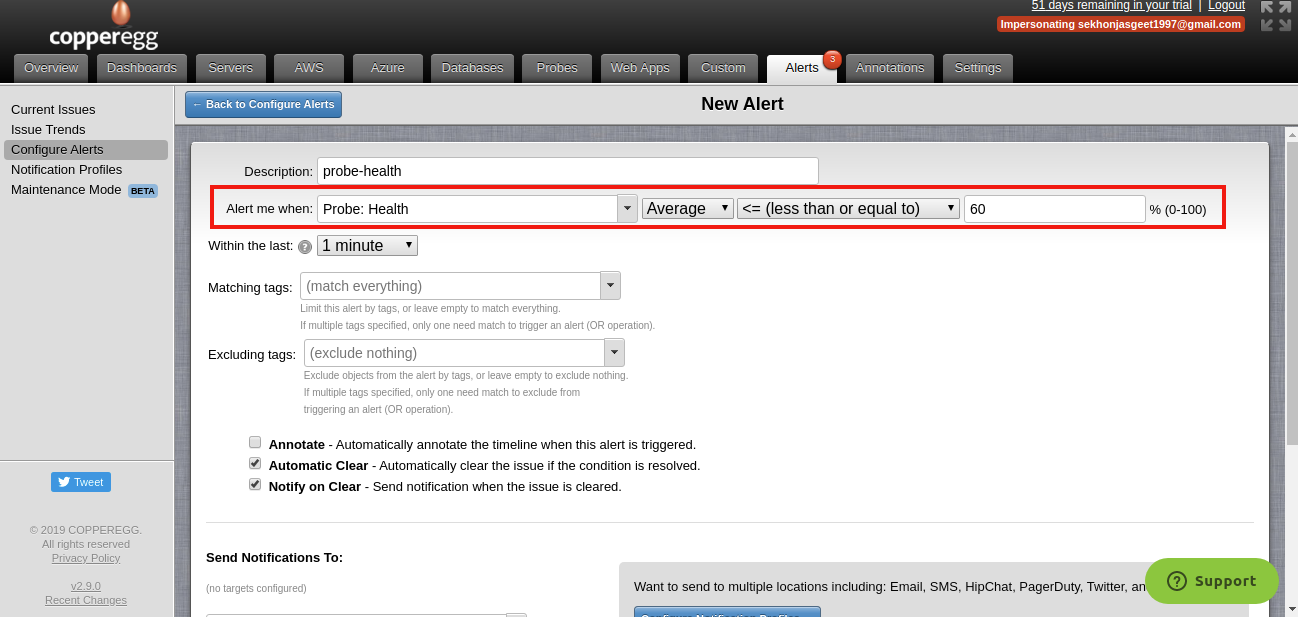
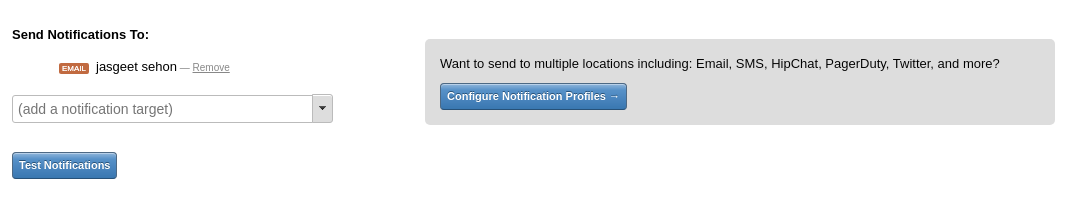
Figure 10: UI for configuring alert condition
- Provide values for these fields in the New Alert page:
- Description: A description of the alert that will be easily recognized by you and your team if the alert is triggered.
- Alert me when: Select the metric of interest and the condition upon which the alert is triggered.
- For at least: The duration for which the alert condition must be valid for the alert to be triggered
- Matching tags: By default, (match everything) is chosen. If needed, you can attach tags to a particular metric object and select those tags here, which would cause only alerts on that metric object to be triggered.
- Excluding tags: By default, (exclude nothing) is chosen. If needed, you can attach tags to a particular metric object and select those tags here, which would cause alerts on that metric object to be skipped.
- Annotate: When enabled, an annotation is automatically created when the alert is triggered. Annotations will be visible in the custom metrics dashboard where the data stream is displayed.
- Automatic Clear: When enabled, the alert issue is automatically cleared if the triggering condition is no longer true
- Notify on clear: When enabled, notifications are also sent when the alert issue is cleared. Please do note that notifications are always sent when the alert issue is triggered.
- Send Notifications To: Here you can configure the notification mechanisms by which the alert is communicated to you and others in your team.
CopperEgg supports notifying different sets of users with differing notification mechanisms for each alert type.
Smart Alerts – Once you install CopperEgg on your server, it automatically configures alerts for the probe added. Some of which include alerting user when
- Poor Health: Alerts when Probe Health <45%
- Site Down: Alerts when uptime (max) < 33%
- Slow Response Time: Alerts when response time (min) >= 6000ms
Notification mechanisms include:
- SMS
- PagerDuty
- HipChat
- Campfire
- Slack
- OpsGenie
Webhooks are also exposed for clients to configure custom notification mechanisms.
More about setting up website probe alerts can be found here.
CopperEgg Free Trial! Sign up today!
Sign up for a 14 day FREE TRIAL of CopperEgg (no Credit Card required).
You can find more information about CopperEgg pricing options here.
We charge only $8 per month per standard server and $16 per month per detailed server.Sign up today!