Monitor a Remote Server using SSH
Are your scripts using SSH to connect to a remote server to perform automated operations on a regular basis?

As an illustration, you can now monitor SSH connectivity to your remote server using IDERA Uptime Cloud Monitor to ensure that the server is accessible via SSH and is not overloaded.
You can configure and receive alerts for the following scenarios:
- Availability of the Remote Server via SSH: Alert if the remote server is not available via SSH or if the SSH ping takes longer than 5 seconds
- High load on the Remote Server: If the CPU, Memory, Load or Network Input/ Output on the Remote Server exceed pre-configured thresholds, alerts can be triggered.
The full set of remote server metrics that are monitored is listed here. You can configure and receive alerts on any of these metrics.
Prerequisites
Uptime Cloud Monitor from IDERA offers a SAAS based out-of-the-box solution for monitoring a Remote Server using SSH. If you are not familiar with the concept of custom metrics as used in Uptime Cloud Monitor, please go through this appendix once before continuing with this document.
- Login to your Uptime Cloud Monitor account
If you don’t already have an account, sign up for a 14 day FREE TRIAL of Uptime Cloud Monitor (no Credit Card required).
- Root access to an on-premise server that can access the remote server via SSH. This is needed to install the Custom Metrics Agent in /usr directory.
- You need root access on the Remote Server being monitored via SSH, to install collector (System Metrics Collector Agent)
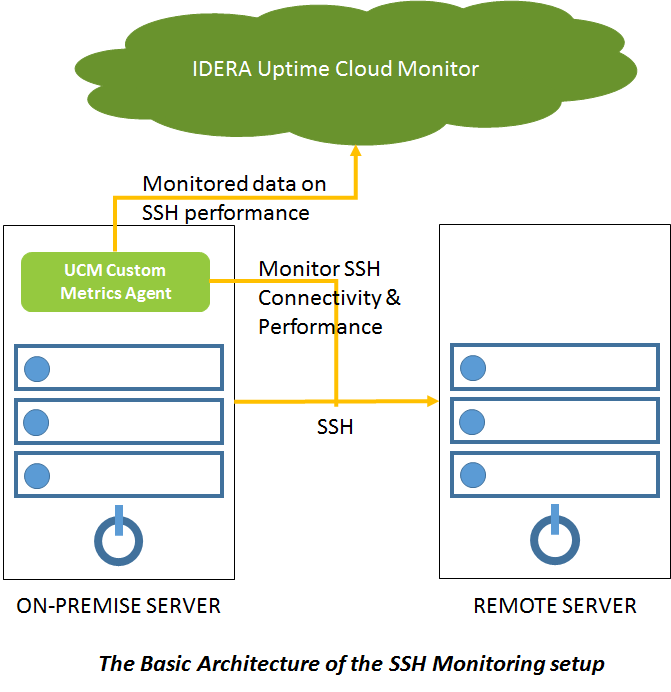
Figure 1: The Basic Architecture of the SSH Monitoring setup
The Custom Metric Agent for SSH Monitoring will be installed on your On-Premise Server. During this installation process, you will be asked to provide the URL/ IP Address and the SSH credentials of the remote server. Once this setup is completed, the Custom Metrics Agent will regularly check that the remote server is accessible via SSH. If any SSH connectivity issues arise, an alert will be triggered and you will be notified about it immediately.
Monitor a Remote Server using SSH
There are three steps that you need to do to start monitoring a Remote Server for SSH accessibility:
- Custom Metrics Agent Installation for SSH Monitoring
- Verify that your SSH Monitoring Dashboard is up and running
- Configure alerts to be notified about SSH connectivity & performance issues
Step 1: Custom Metrics Agent Command Line Installation for SSH Monitoring
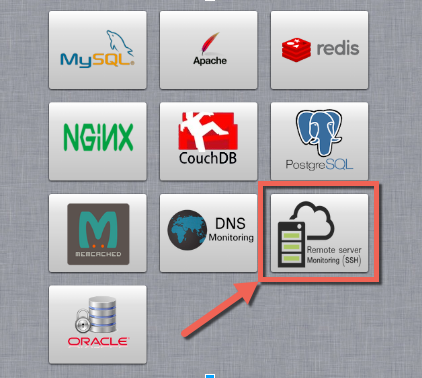
Figure 2: Navigate to Custom Tab -> Getting Started inside IDERA Uptime Cloud Monitor
Login to your UCM account and navigate to Custom tab -> Getting Started. Click on Remote Server Monitoring (SSH) icon displayed above.
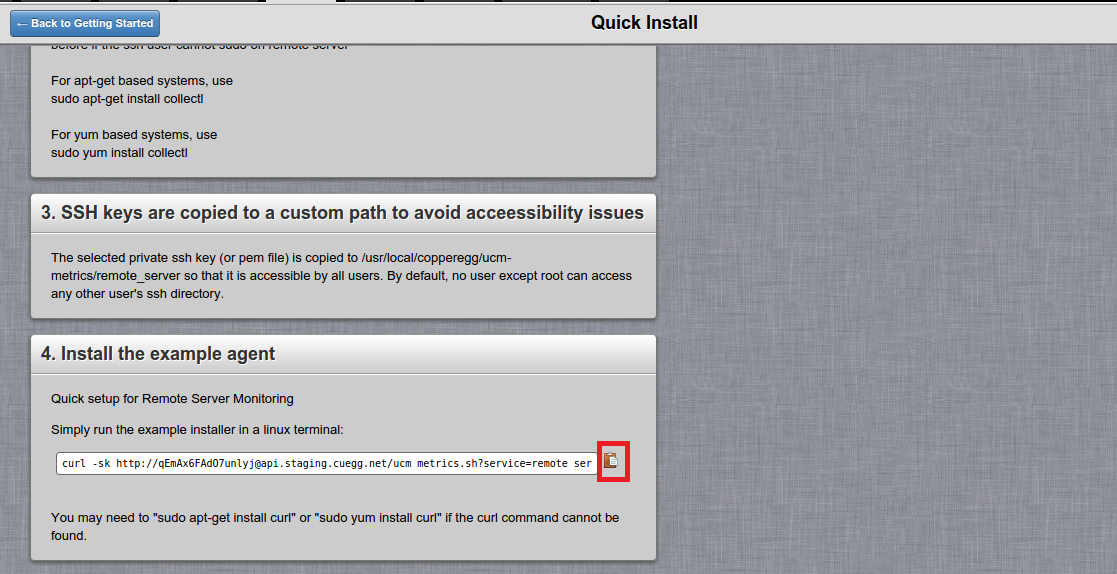
Figure 3: The installer script for the Custom Metrics Agent for SSH Monitoring
- Click on
 icon to copy the installer script to your clipboard.
 - Open Linux terminal window on the on-premise server where you want to install the agent
- Paste the command copied above into the terminal window and press <return> to run the script
- As soon as the script starts running on a terminal with root access, it starts downloading the required Custom Metrics Agent for SSH monitoring.
- You will need to configure the following items in the agent installation process. Item specified in square brackets ( [ ] ) are the default. Just hit <return> to select the defaults.
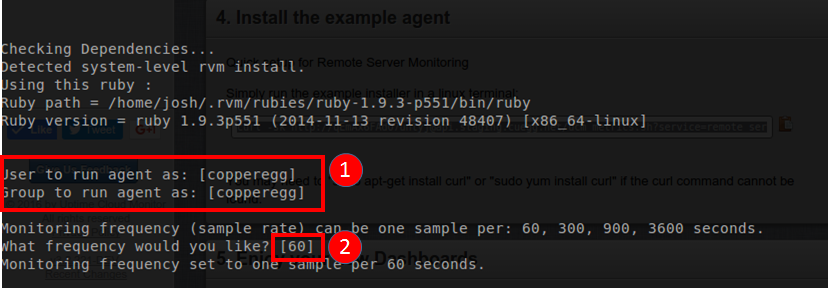
Figure 4: Executing the Custom Metrics Agent installation script with user as copperegg, Group as copperegg and monitoring frequency as 60 seconds
- User and Group for running service as the default values: [copperegg][copperegg]
- Monitoring frequency (sample rate; in seconds): [60]
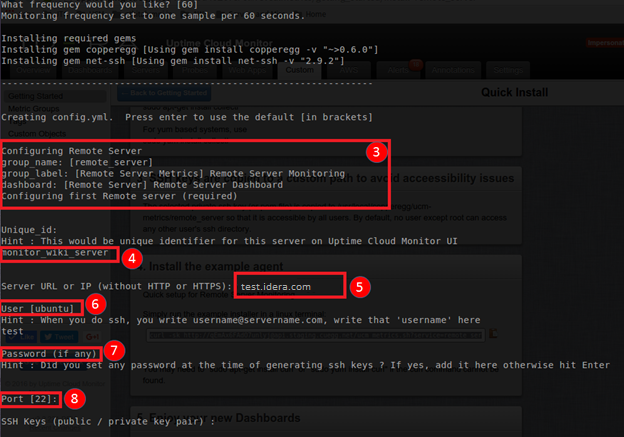
Figure 5: Executing the Custom Metrics Agent installation script with values being set for the Custom Metrics Groups and Dashboard and the SSH connection parameters
- Set values for the Remote Server:
- Custom Metrics Group Name, group_name: [remote_server]
- Custom Metrics Group Label, group_label: [Remote Server Metrics]
- Dashboard name, dashboard: [Remote Server]
- Unique identifier, Unique_id, for the remote server, something like: monitor_wiki_server
- Set the URL or IP for the remote server. There is no default, something like: wiki.copperegg.com
- Specify the unique identifier for the remote server being monitored via SSH
- Specify the URL/ IP address of the remote server to be monitored via SSH
- Specify the User to be used for SSH connections. [ubuntu]
- Specify the Password for SSH. Default is none.
- Specify the Port for SSH. [22]
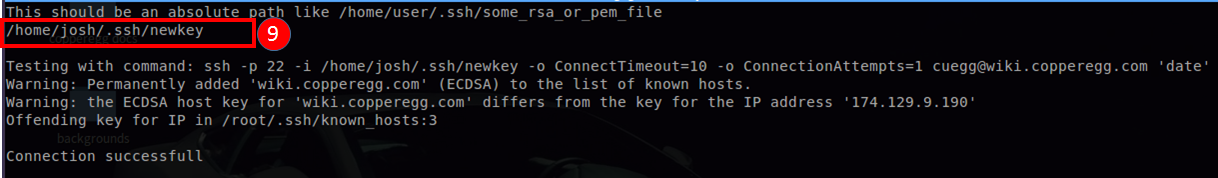
Figure 6: Executing the Custom Metrics Agent installation script with values being set for the path to the RSA/ PEM file
- You can specify the path to the RSA or PEM file to be used to authenticate your SSH connection. This file will only be used locally and will never be uploaded to IDERA Uptime Cloud Monitor.
Step 2: Verify that your SSH Monitoring Dashboards is up and running
Navigate to Dashboards tab and you will see a new SSH Monitoring Dashboard titled “Remote Server Dashboard” has been added automatically by the installer.
In the Dashboards, you will see SSH Ping and Load Avg metrics being monitored:
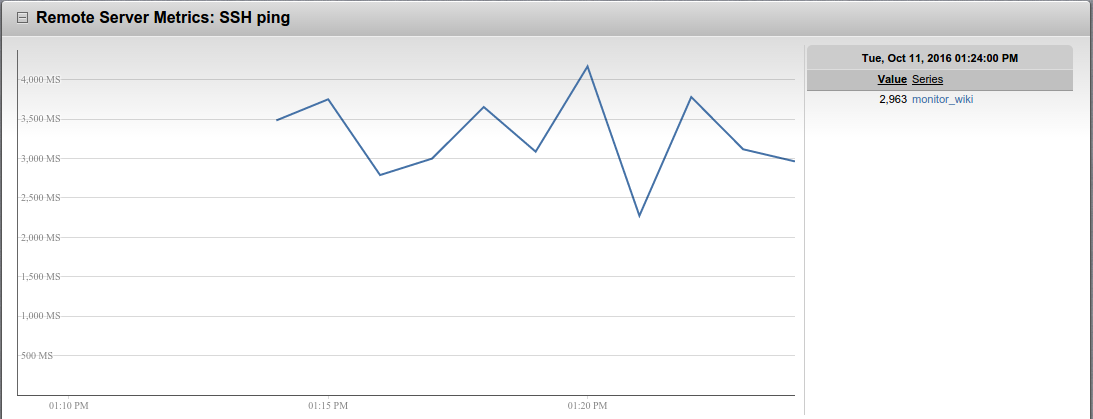
Figure 7: The SSH Remote Server Dashboard displays the SSH Ping response times
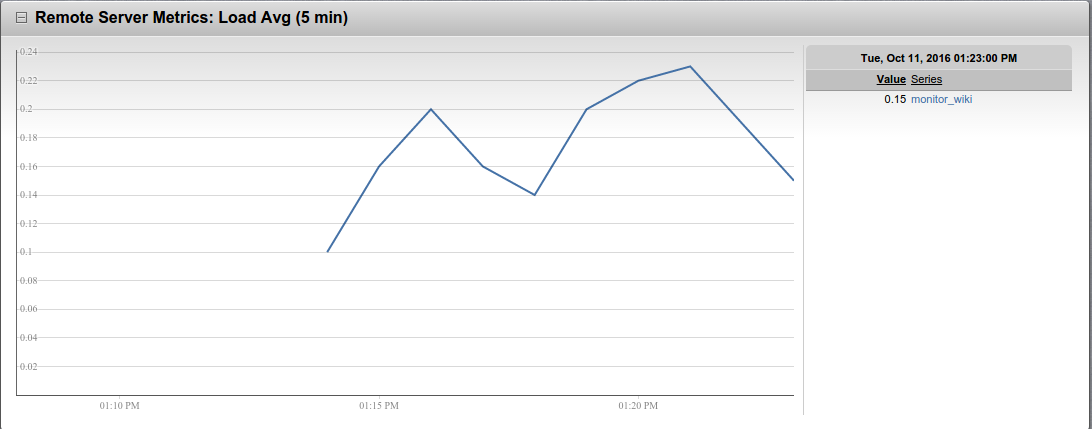
Figure 8: The SSH Remote Server Dashboard displays the Load Average (5 mins) for the Remote Server
Monitored metrics
The complete set of metrics being tracked for the Remote Server via SSH is shown below. You can see the same by navigating to the Custom Tab > Custom Objects and selecting Details on the Custom Metrics Group Label [Remote Server Metrics] that was given as installation input.
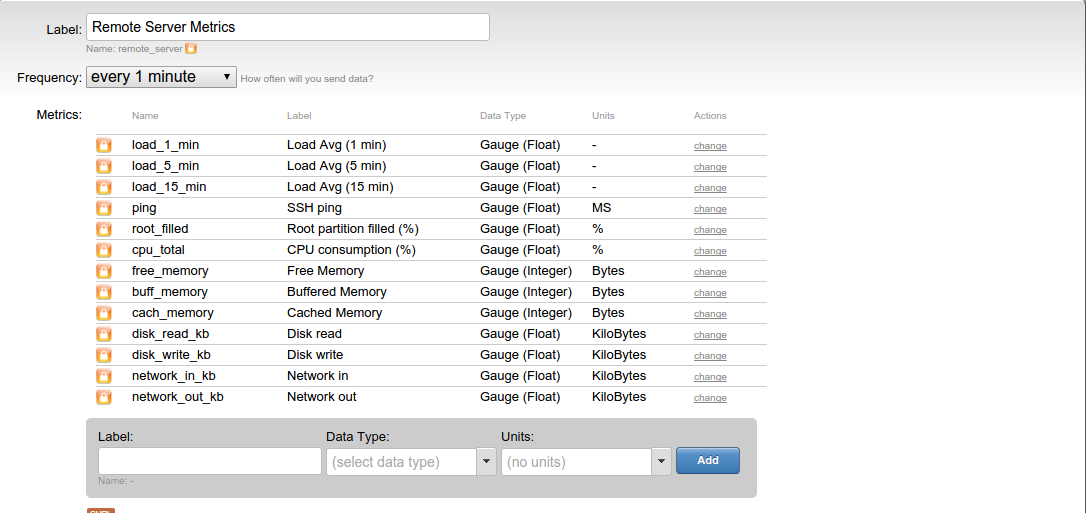
Figure 9: The complete set of metrics being tracked for the Remote Server being monitored via SSH
Step 3: Configure Alerts to be notified about SSH connectivity and performance issues
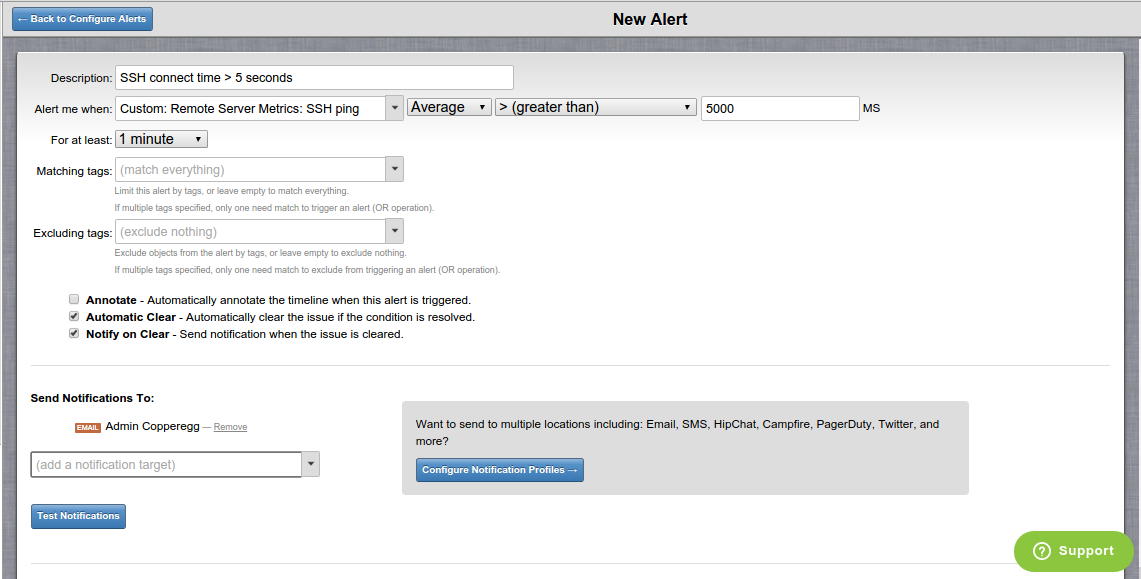
Figure 10: A new alert being added that will be triggered when average SSH Ping values exceed 5000 ms within a time period of 1 min
You can configure new alerts that will be triggered when performance issues with SSH arise. You can also configure the notification mechanisms for a triggered alert.
- Go to Alerts Tab > Configure alerts and click on “New Alerts” button
- Provide values for these fields in the New Alert page:
- Description: A description of the alert that will be easily recognized by you and your team if the alert is triggered
- Alert me when: Select the metric of interest and the condition upon which the alert is triggered. In the Alert me when dropdown, you can prefill “Custom: <your Remote Server Group Label>” to get only the set of relevant metrics for configuring alerts on monitoring the remote server using SSH. In Figure 10, the chosen metric of interest is SSH ping times from the Remote Server Metrics group and the condition for triggering the alert is if the average value is more than 5000 milliseconds
- For at least: The duration for which the alert condition must be valid for the alert to be triggered
- Matching tags: By default, (match everything) is chosen. If needed, you can attach tags to a particular metric object and select those tags here, which would cause only alerts on that metric object to be triggered.
- Excluding tags: By default, (exclude nothing) is chosen. If needed, you can attach tags to a particular metric object and select those tags here, which would cause alerts on that metric object to be skipped.
- Annotate: When enabled, an annotation is automatically created when the alert is triggered. Annotations will be visible in the custom metrics dashboard where the data stream is displayed.
- Automatic Clear: When enabled, the alert issue is automatically cleared if the triggering condition is no longer true
- Notify on clear: When enabled, notifications are also sent when the alert issue is cleared. Please do note that notifications are always sent when the alert issue is triggered.
- Send Notifications To: Here you can configure the notification mechanisms by which the alert is communicated to you and others in your team.
Uptime Cloud Monitor supports notifying different sets of users with differing notification mechanisms for each alert type.
Notification mechanisms include:
- SMS
- PagerDuty
- HipChat
- Campfire
Webhooks are also exposed for clients to configure custom notification mechanisms.
More about setting up website probe alerts can be found here.
Free Trial!
Sign up for a 14 day FREE TRIAL of Uptime Cloud Monitor (no Credit Card required).
You can find more information about Uptime Cloud Monitor pricing options here.
We charge only $0.08 per month per metric!
Sign up Today!
Appendix: A Quick Note on Custom Metrics
Custom Metrics supports monitoring of data samples from any source (hence the name ‘custom’) that are sent as input using simple CURL requests.
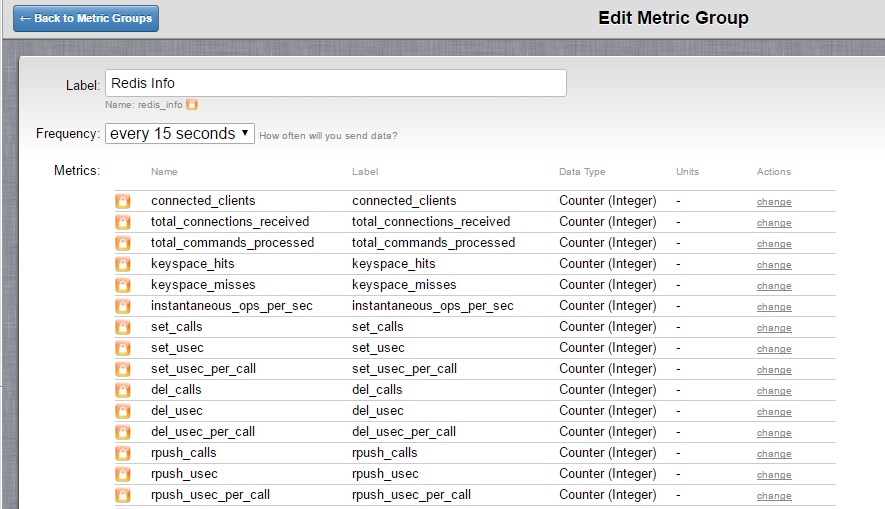
Figure 11: “Redis Info” is a custom metric group that contains many custom metrics
A custom metric is simply a quantity that we want to measure, record, chart and alert on. A custom metric group as the name suggests is a collection of custom metrics that are recorded from the same source.
Data samples can be posted against these custom metrics on a configurable frequency [every 15s, 60s, 300s, 900s and 3600s] using CURL as shown here.
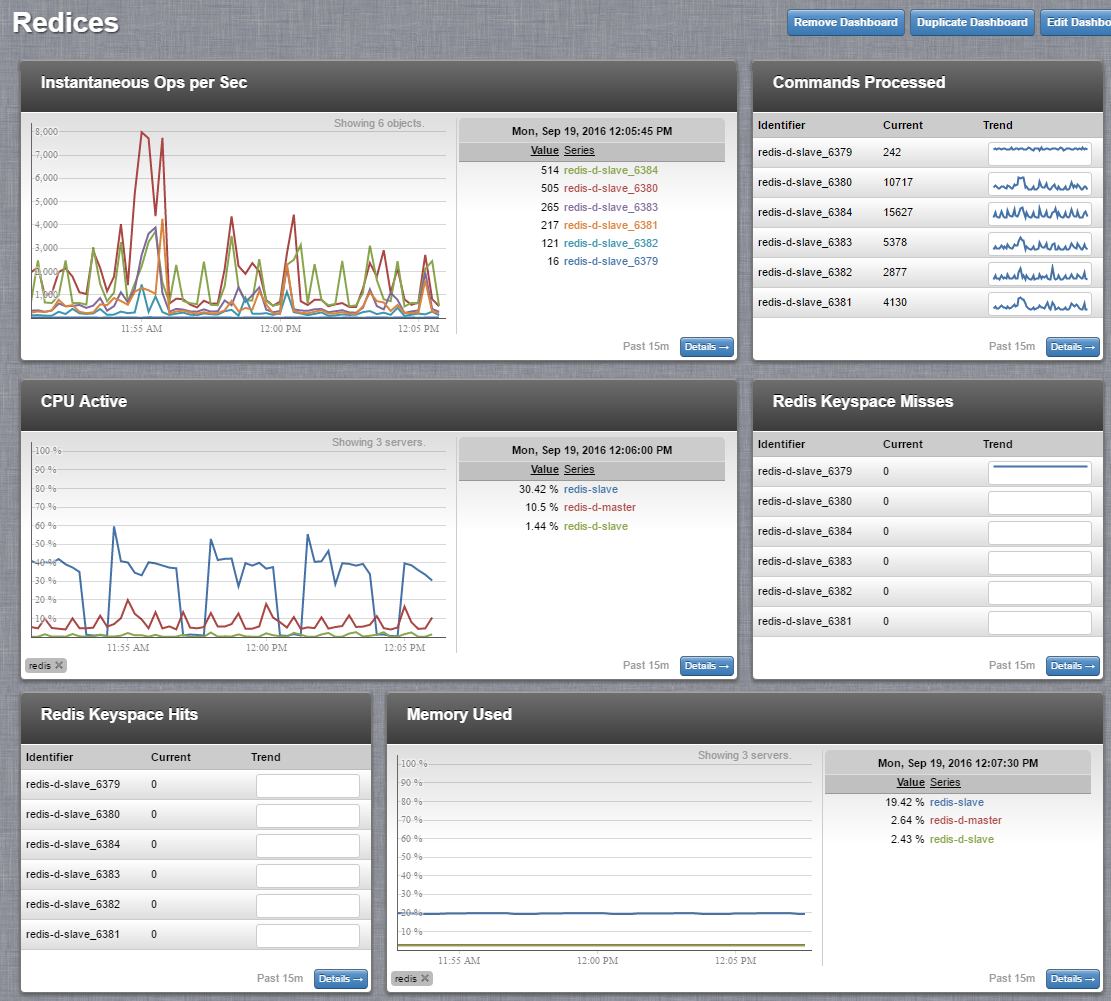
Figure 12: A Dashboard with configurable widgets showing data for custom metrics from the group “Redis Info”
You can create Dashboard with multiple widgets displaying the data samples for custom metrics.
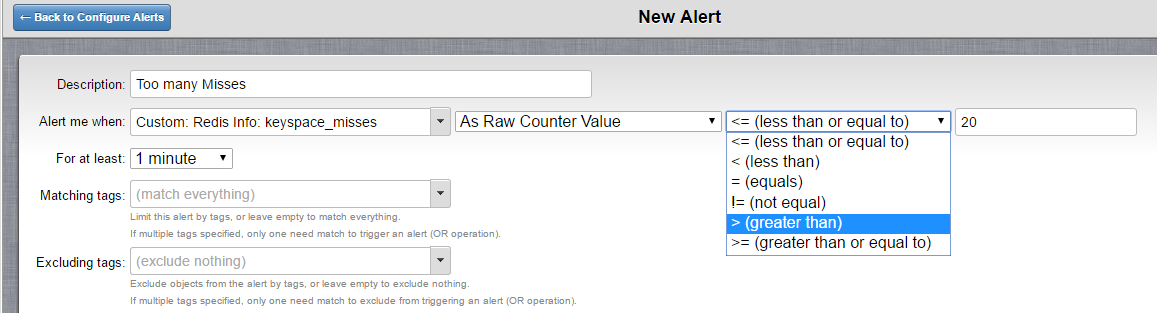
Figure 13: A new alert being added that will be triggered when Keyspace_misses metric exceed a threshold of 20 within a time period of 1 min
Alerts can also be configured against any of these custom metrics. Uptime Cloud Monitor supports notifying different sets of users with differing notification mechanisms for each alert type. Notification mechanisms include email, SMS, PagerDuty, Twitter, HipChat and Campfire. Webhooks are also exposed for clients to configure custom notification mechanisms.