Monitor an Oracle Database Server for Availability & Performance
Are you using an Oracle 11g Database Server in your Application? You can monitor your Oracle Database instance for Availability and Performance using IDERA Uptime Cloud Monitor(UCM).
As an illustration, you can configure and receive alerts for the following scenarios:
- Availability: If the connection time metric goes over a configured threshold (say 5 seconds), you will receive an alert.
- Performance:
- If the current concurrent user sessions exceeds a threshold, you will be alerted that your Oracle DB instance is under high load
- If the Buffer Cache Hit Ratio falls below a threshold, you will be alerted that the Oracle 11g DB instance is not performing optimally.
The full set of metrics monitored for an Oracle 11g instance is listed here. You can configure and receive alerts on any of these metrics.
Prerequisites
Uptime Cloud Monitor from IDERA offers a SAAS based out-of-the-box solution for monitoring Oracle 11g Database instance for availability and performance. If you are not familiar with the concept of custom metrics as used in Uptime Cloud Monitor, please go through Custom Metrics information once before continuing with this document.
- You need an Uptime Cloud Monitor account. If you don’t already have an account, you can sign up for a 14 day FREE TRIAL of Uptime Cloud Monitor here (no Credit Card required).
- Your Oracle 11g Database Server is up and running on a Linux Instance
- Root access to the Linux Server instance to install the Custom Metrics Monitoring Agent.
NOTE: Monitoring an Oracle Database in Windows is also supported. But the installation agent must be run on a Linux Server which has access to the Oracle Database running in Windows.
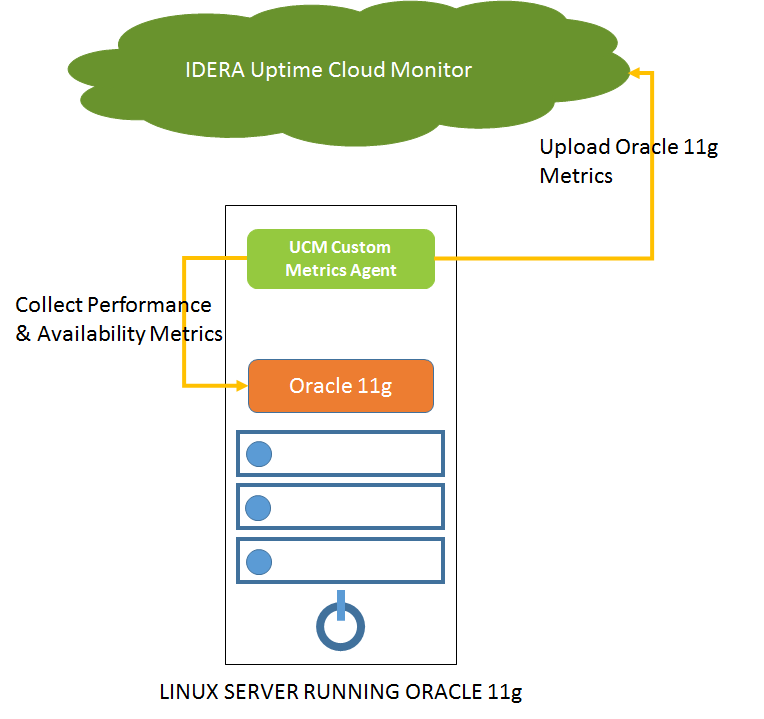
Figure 1: The Basic Architecture of the Oracle 11g Server Monitoring Setup
The Custom Metric Agent will be installed on your Linux Server running Oracle 11g. Once this setup is completed, the Custom Metrics Agent will regularly collect performance & availability metrics from the monitored Oracle 11g Database and upload those metrics to your IDERA Uptime Cloud Monitor Account. If any performance issues arise, an alert will be triggered and you will be notified about it immediately.
Monitor your Oracle 11g Server(on Linux) using IDERA Uptime Cloud Monitor
There are three steps that you need to do to start monitoring an Oracle 11g Database Server using IDERA Uptime Cloud Monitor:
- Custom Metrics Agent Installation to monitor the Oracle 11g Database Server (Linux)
- Verify that your Oracle Monitoring Dashboard is up and running
- Configure alerts to be notified about Oracle 11g Server availability & performance issues
Step 1: Custom Metrics Agent Installation to monitor the Oracle 11g Database Server (Linux)
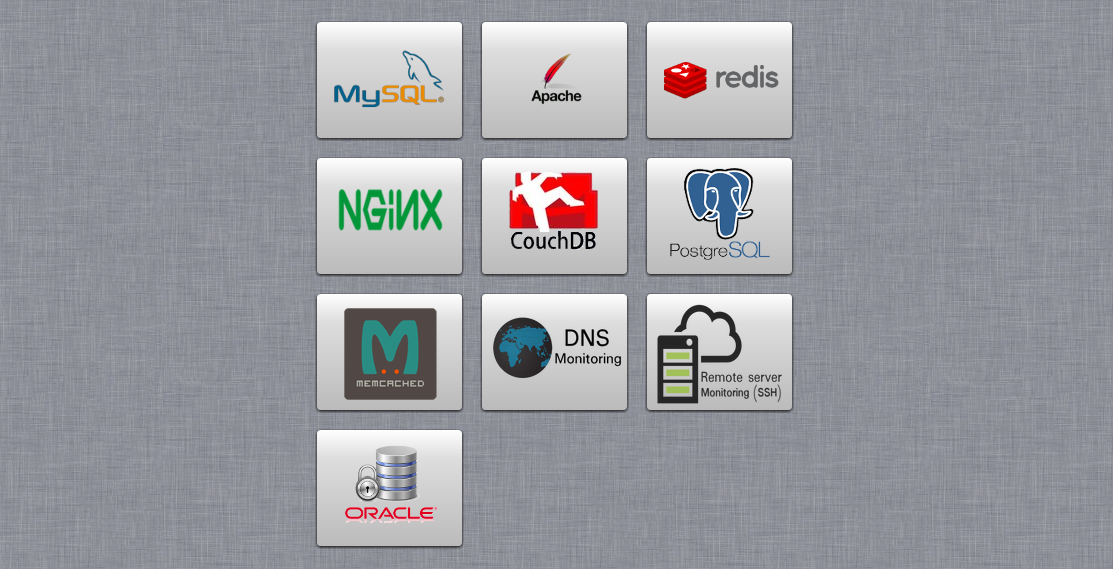
Figure 2: Navigate to Custom Tab -> Getting Started inside IDERA Uptime Cloud Monitor

Login to your Uptime Cloud Monitor account and navigate to Custom tab -> Getting Started. Click on the Oracle icon displayed above.
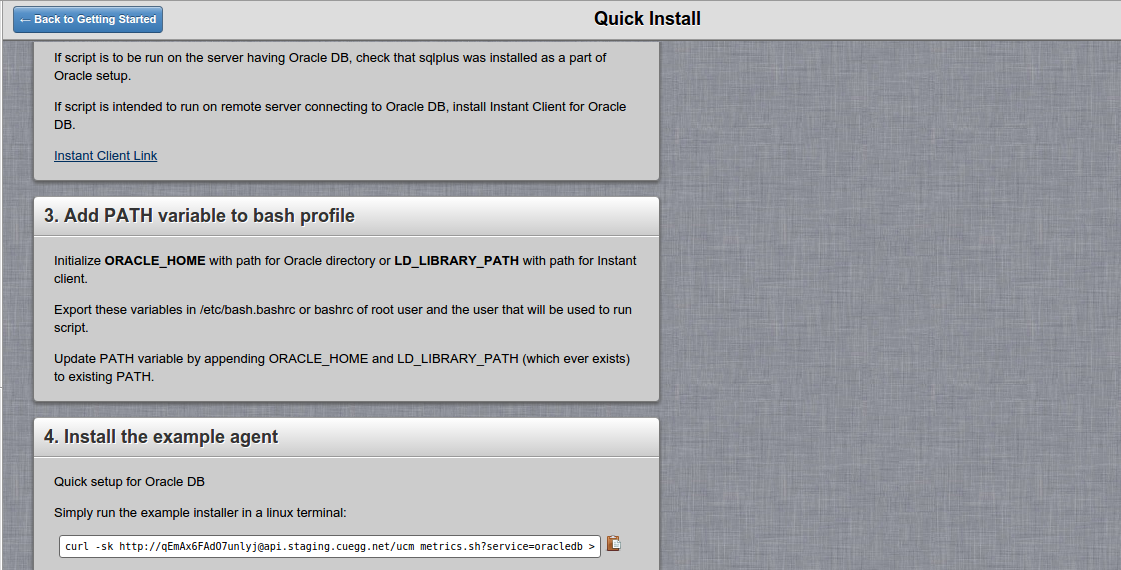
Figure 3: The installer script for the Custom Metrics Agent for Oracle 11g Monitoring
Check the prerequisite steps (step 2 and 3). If Oracle server is installed on a different server machine than the one where this agent is being installed, you need to :
- Install instant client on the remote machine (where you are about to install the agent)
- Update system environment variables (Oracle_HOME, LD_LIBRARY_PATH)
Now, click on ![]() icon to copy the installer script to your clipboard. Paste the command into a terminal window on the Oracle Server to be monitored.
icon to copy the installer script to your clipboard. Paste the command into a terminal window on the Oracle Server to be monitored.
NOTE: This installer script can also be run on another server which is connected to the Oracle Server to be monitored.
As soon as the script is run on a terminal with root privileges, it starts downloading the required Custom Metrics Agent for Oracle monitoring. You will need to configure the following items in the agent installation process. Item specified in square brackets ( [ ] ) are the default.
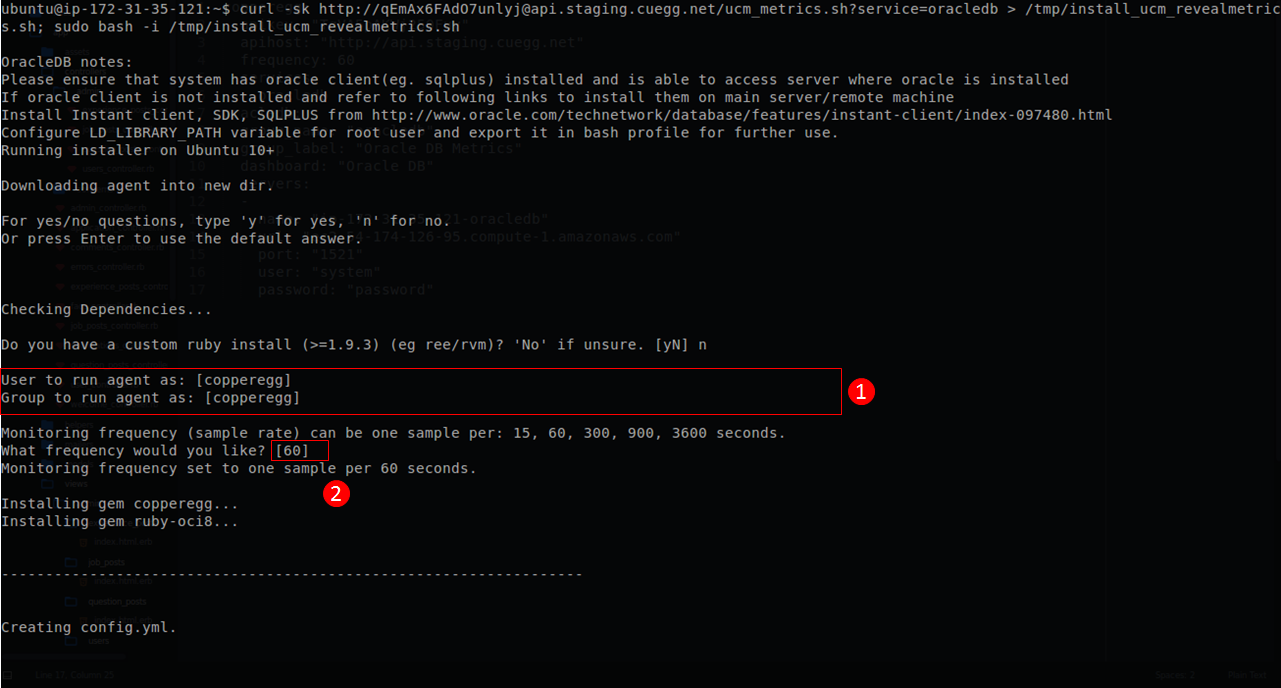
Figure 4: Executing the Custom Metrics Agent installation script with user as copperegg, Group as copperegg and monitoring frequency as 60 seconds
- User and Group for running service as the default values: [copperegg][copperegg]
- Monitoring frequency: 15, [60], 300, 900, 3600 seconds
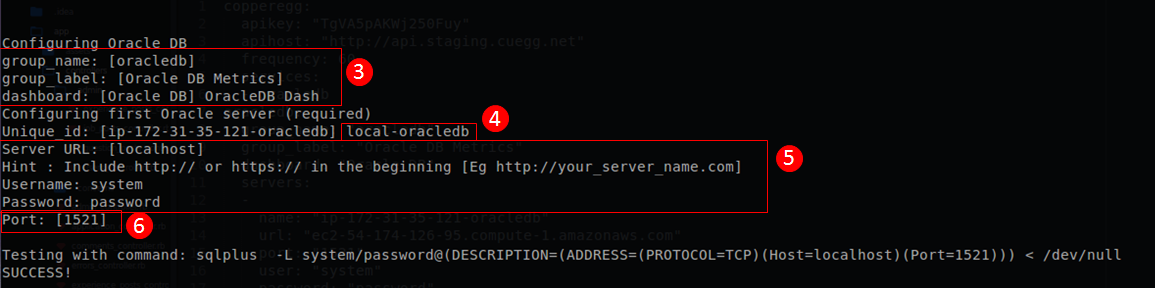
Figure 5: Executing the Custom Metrics Agent installation script with values being set for the Custom Metrics Groups and Dashboard and the Oracle Server connection parameters
- Set values for the Custom Metrics Group name, Customer Metrics Group Label and the Dashboard name to the values [Oracledb], [OracleDB Metrics] and “Oracle DB Dash” respectively.
- Set the unique identifier for this Oracle server as “local-Oracledb”
- Set the URL for the Oracle Server as localhost and mention the username and password to connect to the Oracle Server
- Specify the port. The default of [1521] is set.
Step 2: Verify that your Oracle Monitoring Dashboard is up and running
Navigate to Dashboard and you will see a new Oracle Monitoring Dashboard titled “Oracle DB Dash” has been added automatically by the installer.
Some of the metrics you will see in this Dashboard are listed below:
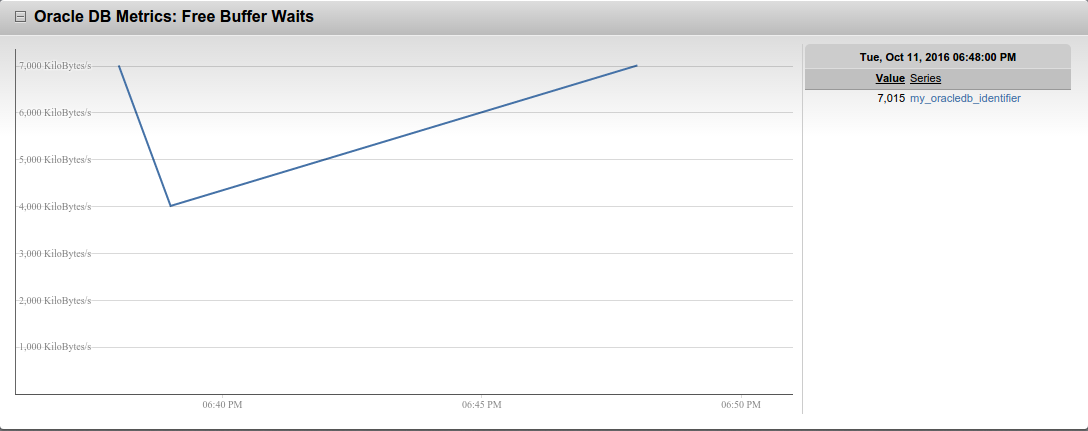
Figure 6: Oracle DB Dashboard showing the Free Buffer Waits
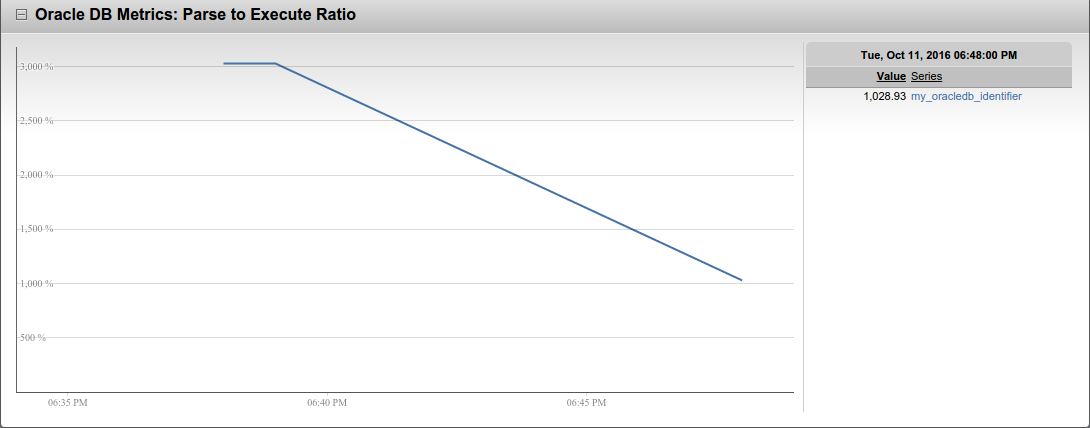
Figure 7: Oracle DB Dashboard showing the Parse to Execute Ratio
Monitored metrics
Uptime Cloud Monitor currently monitors 15 metrics which cover most of the important metrics for an Oracle Database from a performance and stability perspective. You can see these 15 metrics by navigating to the Custom Tab > Custom Objects and selecting Details on the Custom Metrics Group Label [Oracle DB Metrics] that was given as installation input. For some of these metrics, alerts have been automatically created (see section 3 below). To create new alerts see section: Configuring your own Alerts for Oracle Database.
The metrics are:
- buf_cache_hits: Buffer Cache Hit Ratio
- mem_sort_ratio: In Memory Sort Ratio
- parse_execute_ratio: Parse to Execute Ratio
- sql_area_ratio: SQL Area Get Ratio
- buf_busy_waits: Buffer Busy Wait
- free_buf_waits: Free Buffer Waits
- wrt_complete_waits: Write Complete Wait
- consistent_gets: Consistent Gets
- db_block_gets: DB Block Gets
- physical_reads: Physical Reads
- max_concurrent_sessions: Maximum Concurrent User Sessions Allowed
- curr_concurrent_sessions: Current Concurrent User Sessions (alert automatically created)
- highest_concurrent_sessions: Highest Concurrent User Sessions
- max_named_users: Maximum Named Users Allowed
- connection_time: Connection Time
Step 3: Configure Alerts to be notified about Oracle 11g Server Availability and performance issues
Default Pre-Configured Alerts for the Oracle Database
As soon as your Oracle Database Monitoring Dashboard comes up, you will notice that some alert configurations have been automatically created by our Installation Script (under Alerts > Configure Alerts). These pre-configured alerts for Oracle Database include:
| Sr. No. | Metric Name | Definition | Alert Definitions | Duration |
| 1 | Current Concurrent Sessions | The number of concurrent sessions. | Alert will be triggered if sessions reach 1600. | 3 Min |
If the alerting condition is met for these pre-configured alerts, some alert notifications may also be triggered.
Configuring your own Alerts for the Oracle Database
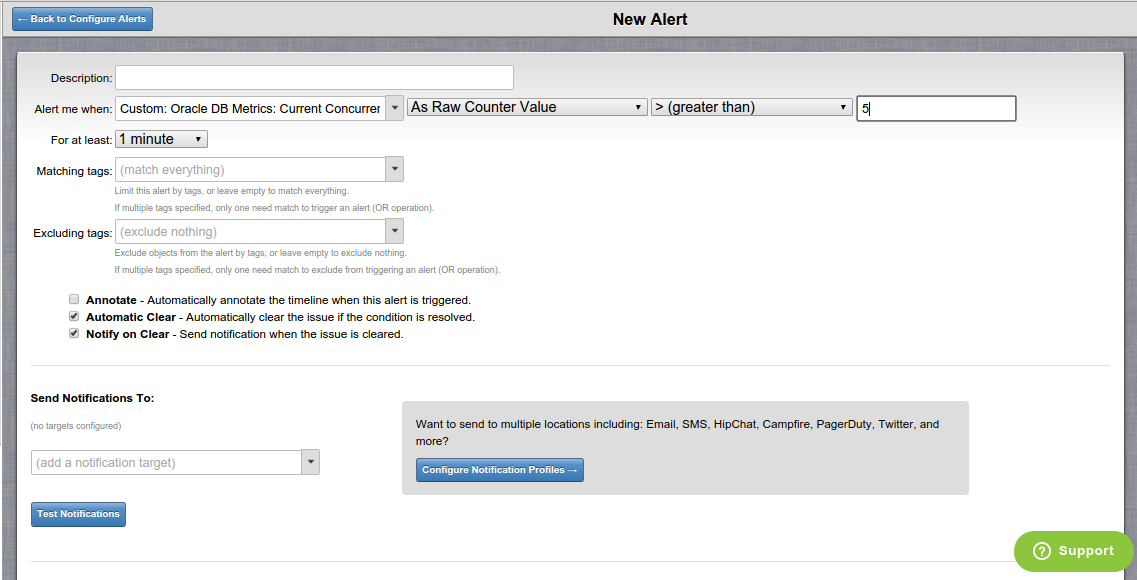
Figure 8: A new alert being added that will be triggered when more than 5 concurrent users are connected to your OracleDB
You can configure new alerts that will be triggered when performance issues arise with your Oracle 11g DB. You can also configure the notification mechanisms for a triggered alert.
- Go to Alerts Tab > Configure alerts and click on “New Alerts” button
- Provide values for these fields in the New Alert page:
- Description: A description of the alert that will be easily recognized by you and your team if the alert is triggered
- Alert me when: Select the metric of interest and the condition upon which the alert is triggered. In the Alert me when dropdown, you can prefill “Custom: <your Oracle Metrics Group Label>” to get only the set of relevant metrics for configuring alerts for your Oracle DB instance. In Figure 8, the chosen metric of interest in ‘Alert me when’ is ‘Custom: OracleDB Metrics: Current Concurrent Users’ from the Oracle DB Metrics group and the condition for triggering the alert is if the value is more than 5.
- For at least: The duration for which the alert condition must be valid for the alert to be triggered
- Matching tags: By default, (match everything) is chosen. If needed, you can attach tags to a particular metric object and select those tags here, which would cause only alerts on that metric object to be triggered.
- Excluding tags: By default, (exclude nothing) is chosen. If needed, you can attach tags to a particular metric object and select those tags here, which would cause alerts on that metric object to be skipped.
- Annotate: When enabled, an annotation is automatically created when the alert is triggered. Annotations will be visible in the custom metrics dashboard where the data stream is displayed.
- Automatic Clear: When enabled, the alert issue is automatically cleared if the triggering condition is no longer true
- Notify on clear: When enabled, notifications are also sent when the alert issue is cleared. Please do note that notifications are always sent when the alert issue is triggered.
- Send Notifications To: Here you can configure the notification mechanisms by which the alert is communicated to you and others in your team.
Uptime Cloud Monitor supports notifying different sets of users with differing notification mechanisms for each alert type. Notification mechanisms include:
- SMS
- PagerDuty
- HipChat
- Campfire
- Slack
- OpsGenie
Webhooks are also exposed for clients to configure custom notification mechanisms. More about setting up website probe alerts can be found here.
Uptime Cloud Monitor Free Trial! Sign up today!
Sign up for a 14 day FREE TRIAL of Uptime Cloud Monitor (no Credit Card required).
You can find more information about Uptime Cloud Monitor pricing options here.
We charge only $0.08 per month per metric!
Sign up today!