If you have a Windows server and you want to monitor your server’s real-time processing and performance, you can use CopperEgg to monitor the overall condition of your Windows Server.
Real-time data is displayed for
- All system processes,
- Memory,
- File Systems
- Disk I/O, and a lot more
You can monitor all these things for your physical as well as virtual servers, whether it be on AWS, Azure or any other cloud hosting platform.
Supported windows versions – Windows 2003 R2 and above
Prerequisites-
- Copperegg account (if you don’t have an account you can easily create one here without a credit card and have a 15 days free trial of CopperEgg).
- Windows server up and running.
- Root access to server (to install CopperEgg Installer)
Windows Monitoring
There are three steps on getting started with windows server monitoring using CopperEgg
- Download windows installer
- Verify that the agent is up and running
- Configure alerts to be notified about server’s performance issues
- Enable detailed server monitoring (optional)
Step 1: Download Windows Installer
- Sign in to CopperEgg – Use login credentials you used while signing up or you can also Sign in via Google
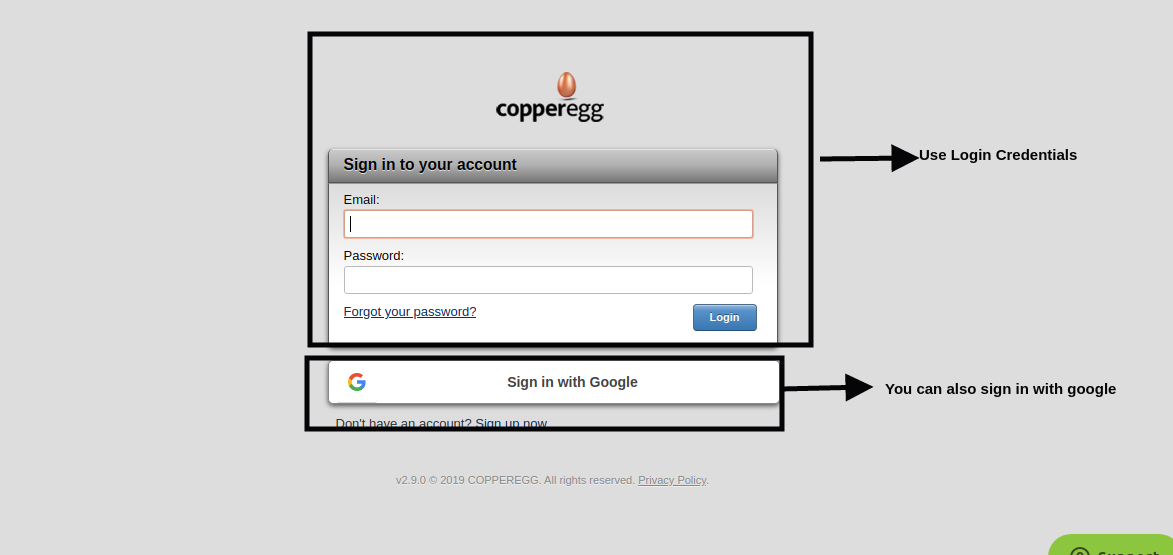
Figure 1: Sign in to CopperEgg
- Click on Servers tab and then on the button Add a server.
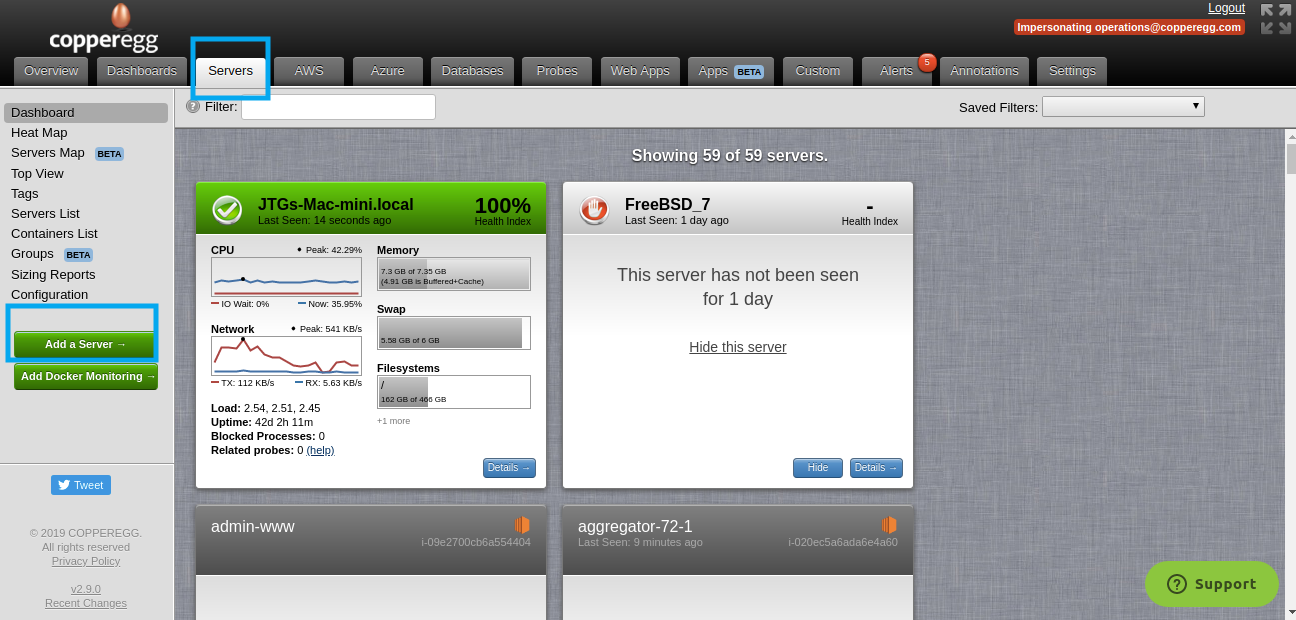
Figure 2: Add a Server button
- Choose your O.S to be Windows.
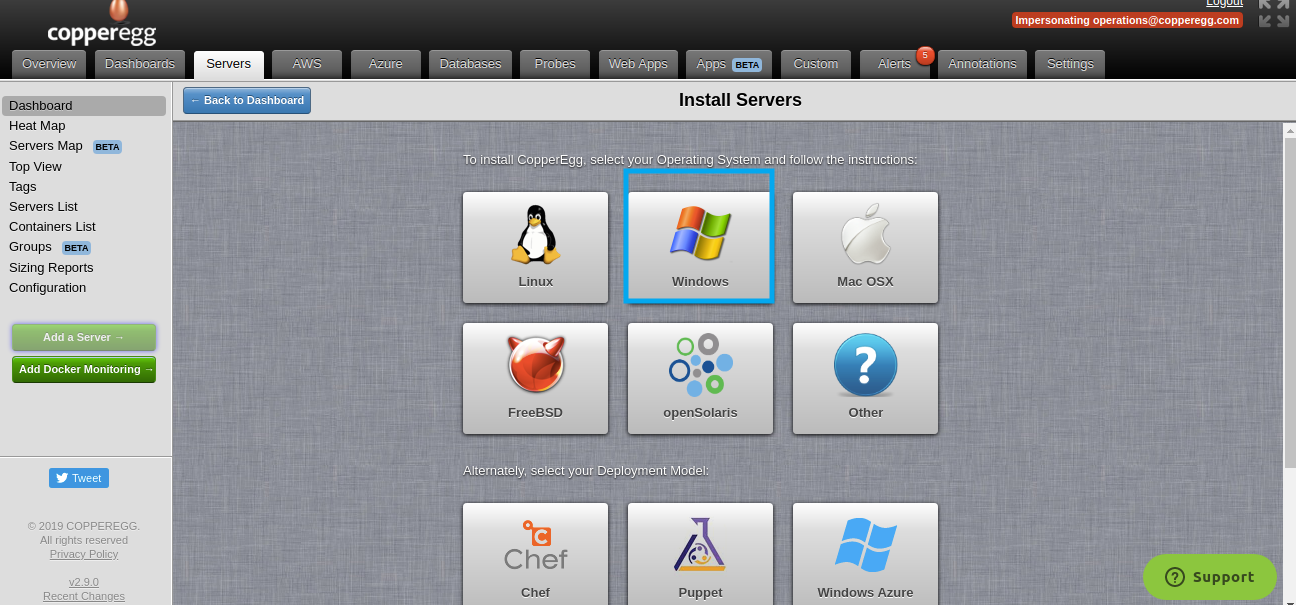
Figure 3: Choose Windows Server
- To install CopperEgg to your server select your Windows server’s version and then copy the given API key .
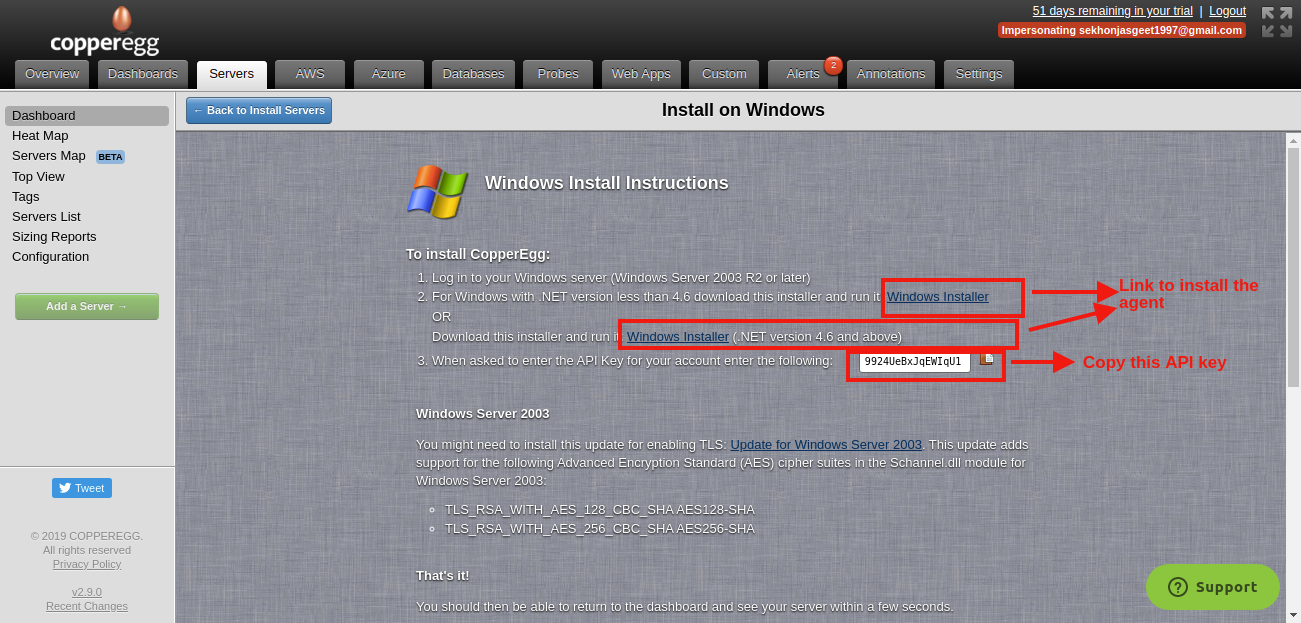
Figure 3: Install CopperEgg Agent
- Click on the given link Windows Installer a file will get downloaded in your browser then open that file and click on Run, then Next
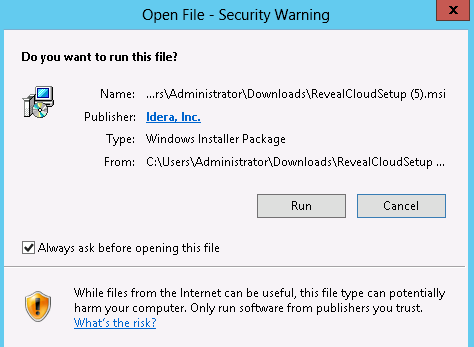
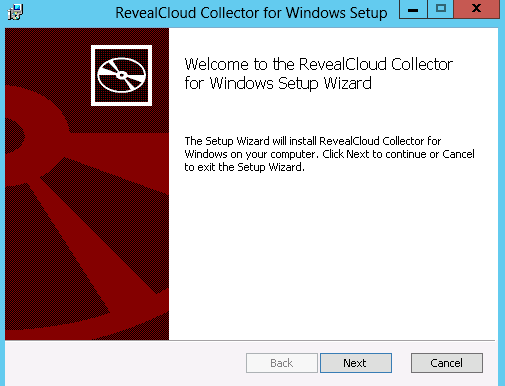
Figure 5: Run the CopperEgg Installer for Windows Monitoring
- Enter the API key provided in CopperEgg Dashboard (See Figure 4) and click on Next and then Install
. 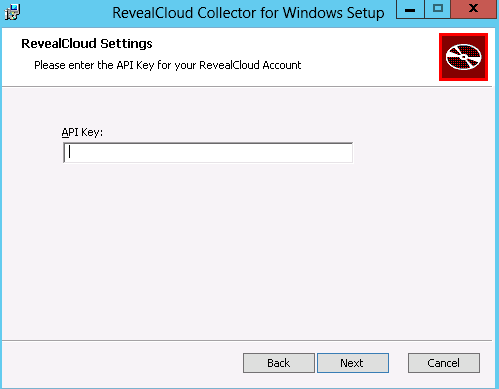
Figure 6: Enter the API Key
Step 2: Verify that the Agent is up and running
- Navigate to Servers tab and then to Dashboard, you’ll see that a new Server has automatically been added by the Agent.
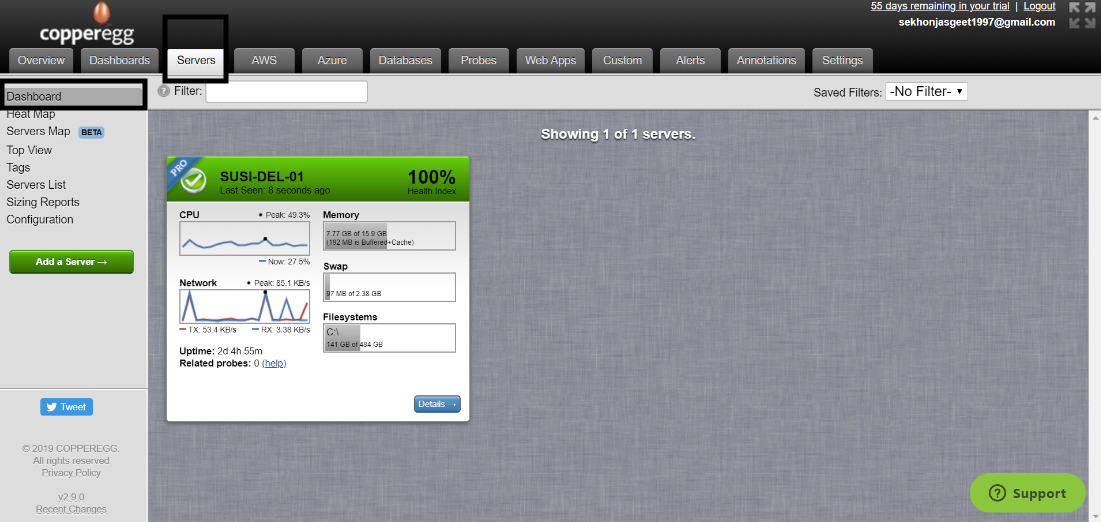
Figure 7: Widget for the new Windows Server
- Click on Details button to monitor the server as now data samples are being sent from the server to your CopperEgg application
- Section showing details of the server on which the collector is installed.
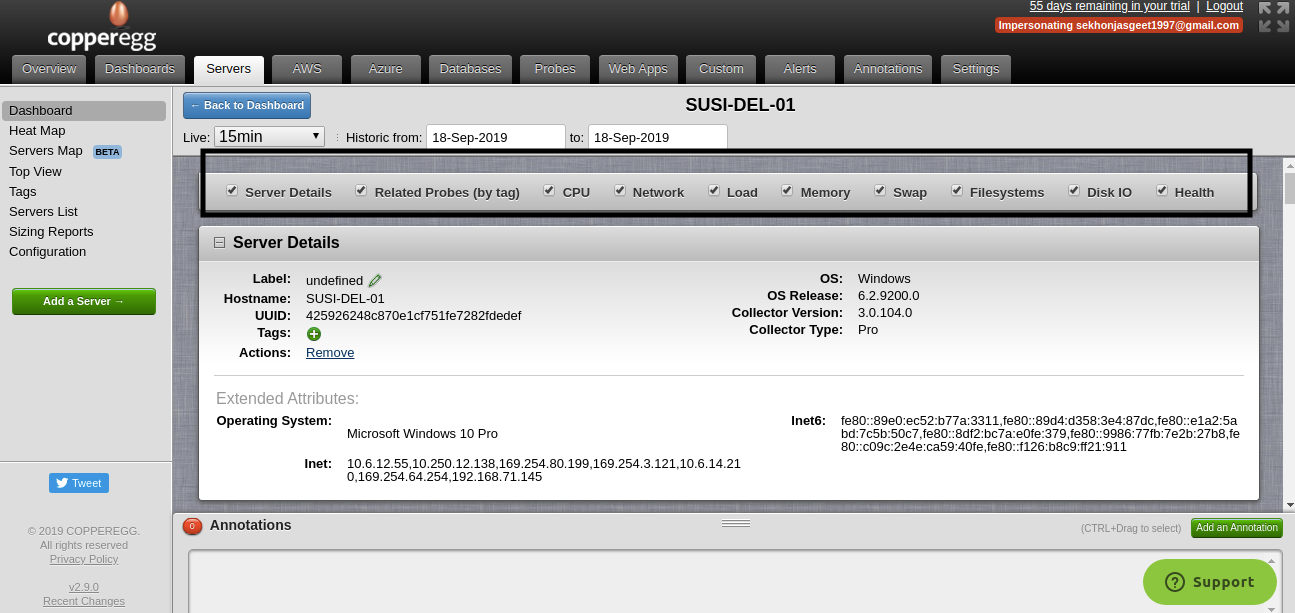
Figure 8: Section of the Details View showing details of the server
- Chart displaying CPU report (one can click on Processes and Details to get detailed idea about all the processes running on CPU).
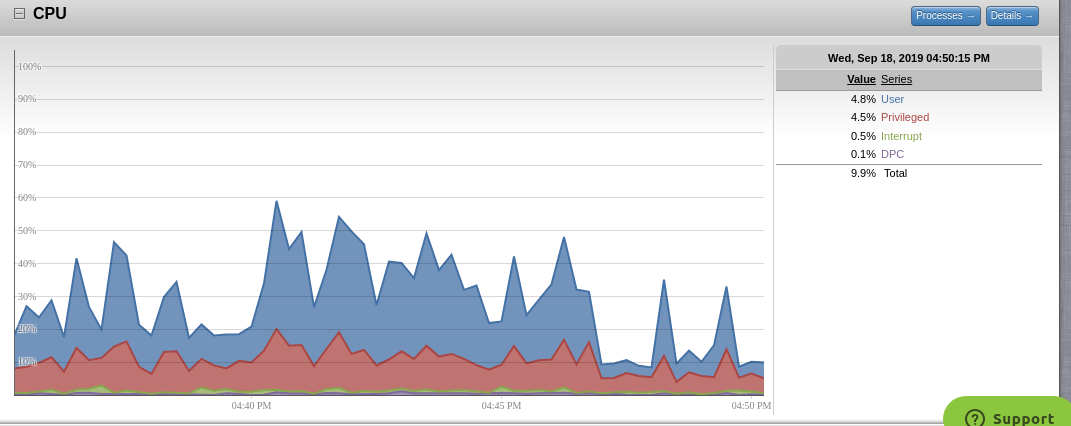
Figure 9: Chart displaying CPU details
- Table displaying the list of CPU processes in detail. Note: Process details are only available when Detailed Server Monitoring is enabled.
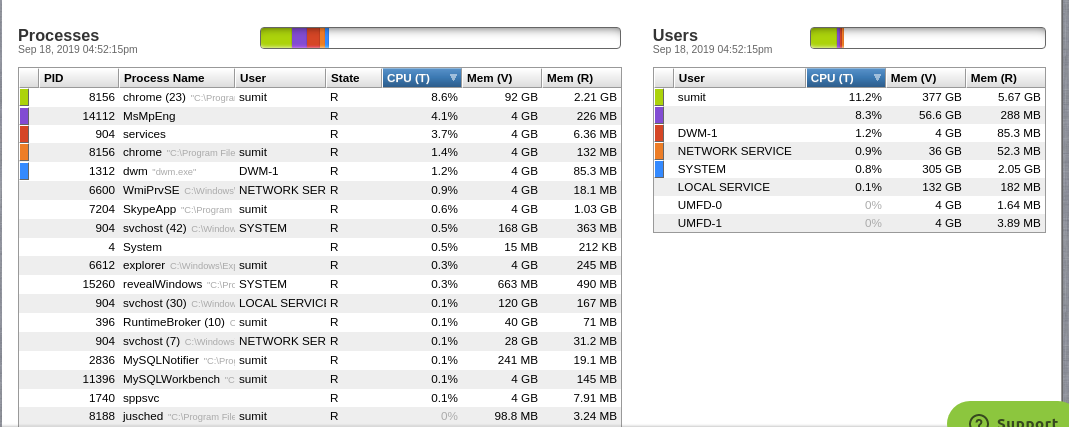
Figure 10: Table displaying CPU Process details
- Chart displaying Networks
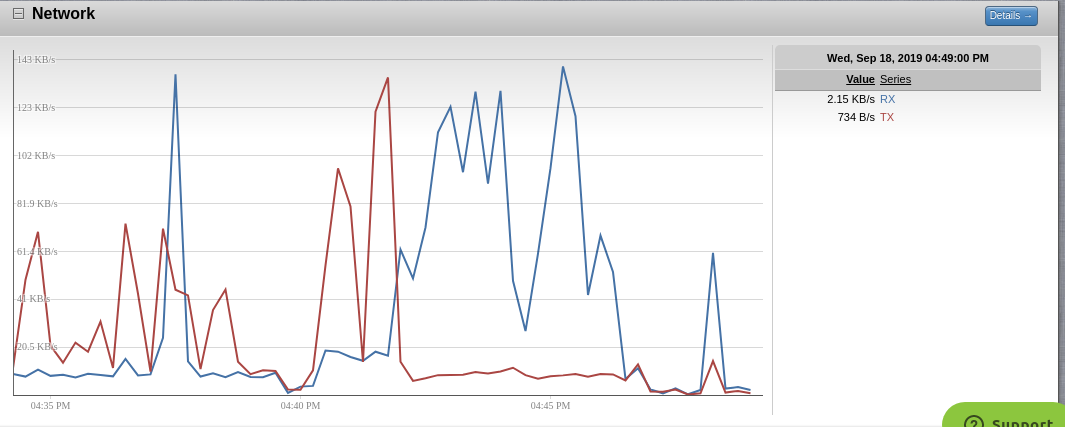
Figure 11: Chart displaying Network details
- Chart displaying memory usage. Note: Memory details for processes are only available when Detailed Server Monitoring is enabled.
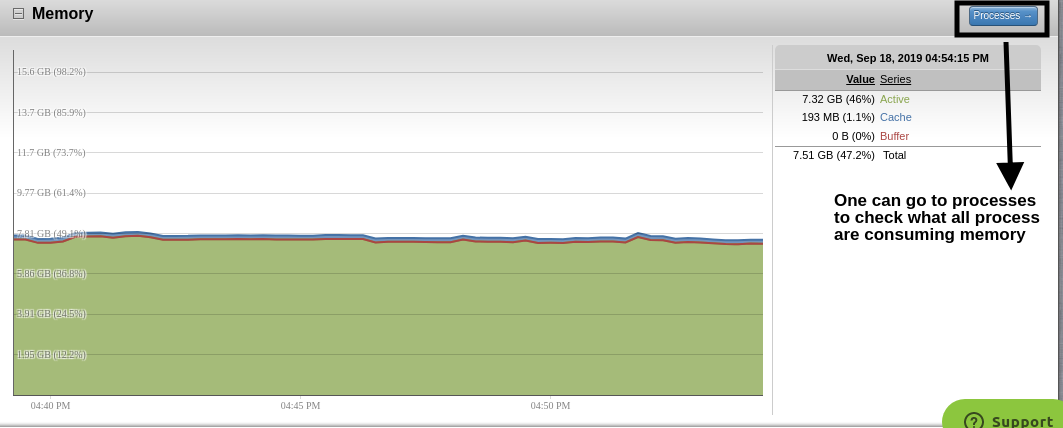
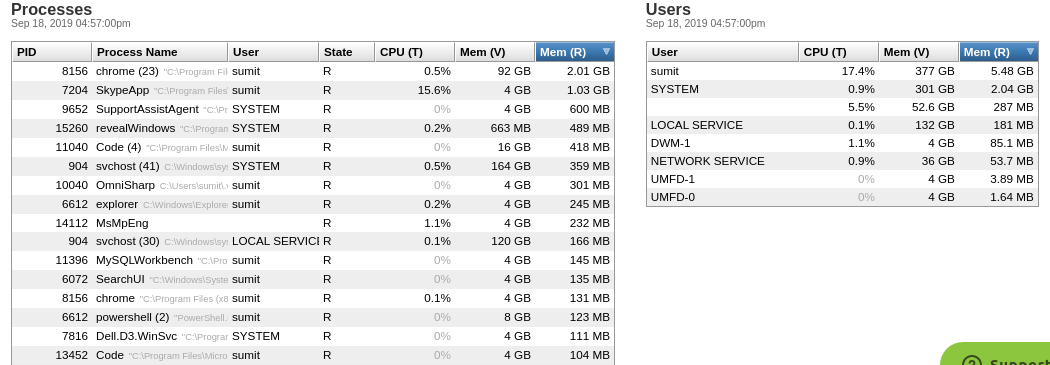
Figure 12: Chart displaying Memory Usage
Monitored metrics- CopperEgg monitors a number of metrics of Windows servers, which are
- CPU
- Memory
- Network
- Swap
- File Systems
- Disk IO
- Health
Step 3: Configure Alerts
Alerts are basically used to notify when a particular state is reached by the server. Alerts are pre-configured but can also be customized according to one’s needs.
- For configuring Alerts , one can navigate to Alerts tab and then select Configure Alerts from the left panel and then New Alert.
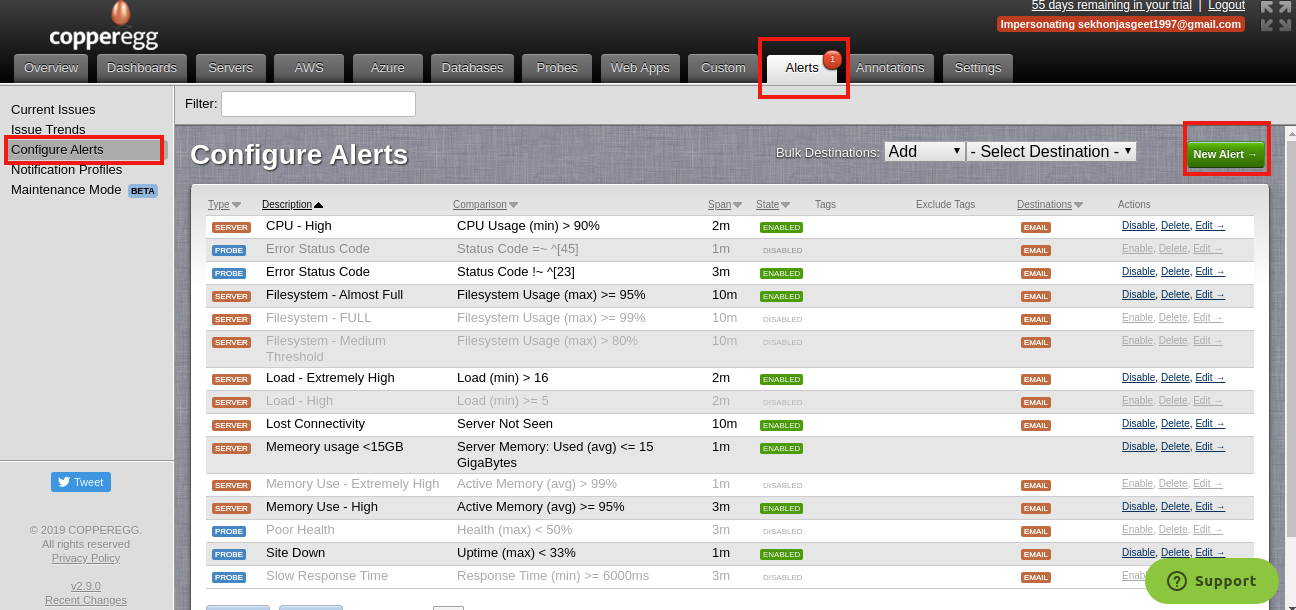
Figure 13: Configuring Alerts
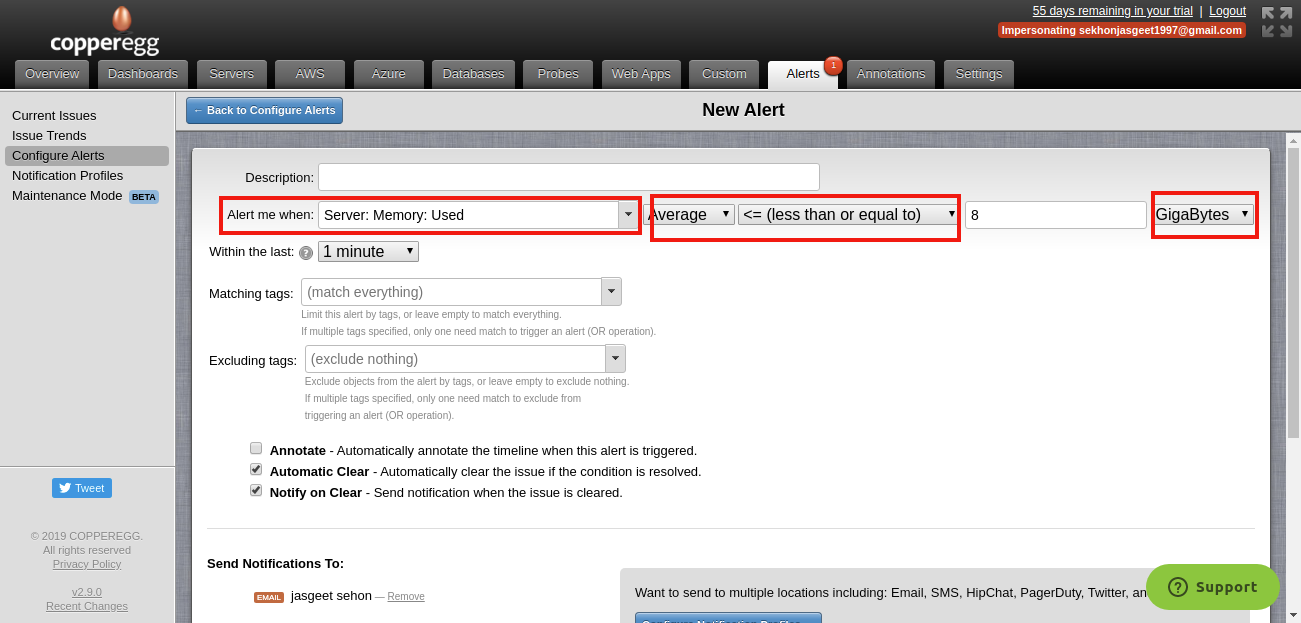
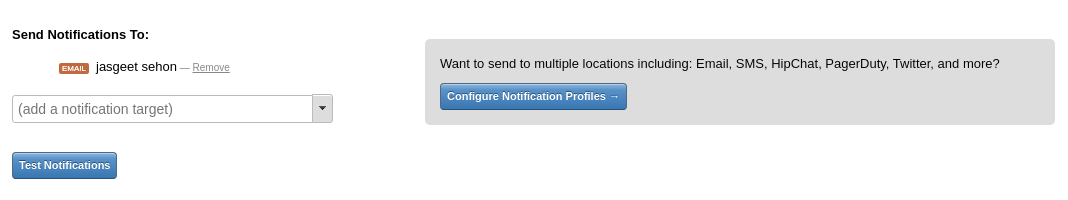
Figure 14: UI for configuring alert condition
- Provide values for these fields in the New Alert page:
- Description: A description of the alert that will be easily recognized by you and your team if the alert is triggered.
- Alert me when: Select the metric of interest and the condition upon which the alert is triggered.
- For at least: The duration for which the alert condition must be valid for the alert to be triggered
- Matching tags: By default, (match everything) is chosen. If needed, you can attach tags to a particular metric object and select those tags here, which would cause only alerts on that metric object to be triggered.
- Excluding tags: By default, (exclude nothing) is chosen. If needed, you can attach tags to a particular metric object and select those tags here, which would cause alerts on that metric object to be skipped.
- Annotate: When enabled, an annotation is automatically created when the alert is triggered. Annotations will be visible in the custom metrics dashboard where the data stream is displayed.
- Automatic Clear: When enabled, the alert issue is automatically cleared if the triggering condition is no longer true
- Notify on clear: When enabled, notifications are also sent when the alert issue is cleared. Please do note that notifications are always sent when the alert issue is triggered.
- Send Notifications To: Here you can configure the notification mechanisms by which the alert is communicated to you and others in your team.
CopperEgg supports notifying different sets of users with differing notification mechanisms for each alert type.
Smart Alerts – Once you install CopperEgg on your server, it automatically configures alerts for the type of server added and helps troubleshoot system and application issues.
Some of which include alerting user when
- High CPU usage : Alert is generated when CPU usage is more than 90
- Memory Use – High:Alert is generated when Active Memory is more than 95%
- Lost Connectivity:Alert generated when server is not seen
- Filesystem-Almost Full :Alert is generated when filesystem usage is more than 95%
Notification mechanisms include:
- SMS
- PagerDuty
- HipChat
- Campfire
- Slack
- OpsGenie
Webhooks are also exposed for clients to configure custom notification mechanisms.
Step 4-Enable Detailed Server Monitoring (optional)
If needed you can optionally enable detailed server monitoring so that CPU and memory details of processes are also fetched.
You can add a tag pro to your server widget to enable detailed server monitoring.
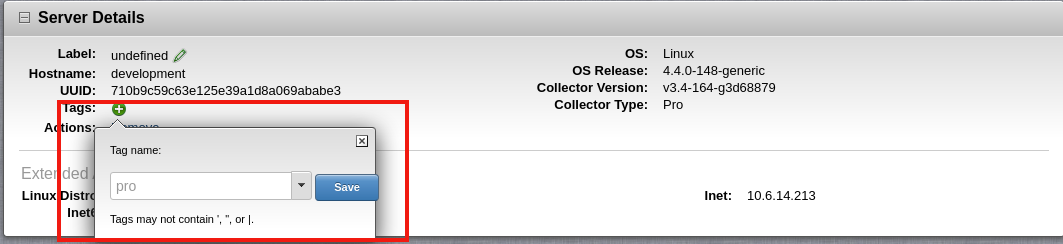
Figure 15: “pro”tag being added
With detailed server monitoring you can also configure alerts for specific processes in your Server.
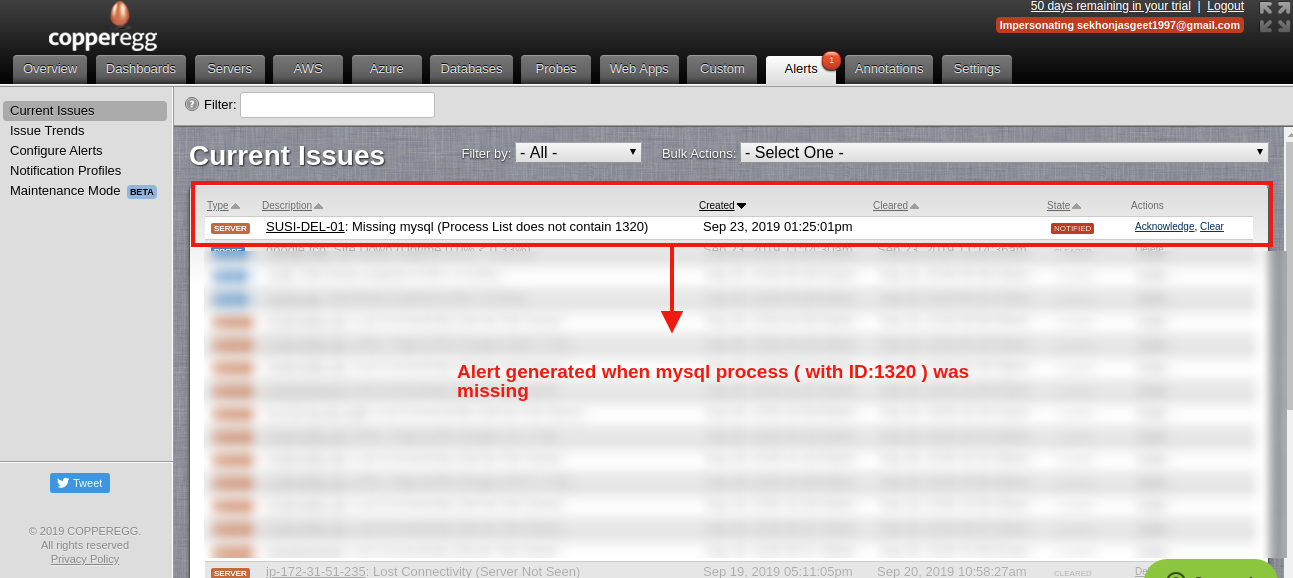
Figure 16: Alert for missing process
CopperEgg Free Trial! Sign up today!
Sign up for a 14 day FREE TRIAL of CopperEgg (no Credit Card required).
You can find more information about CopperEgg pricing options here.
We charge only $8 per month per standard server and $16 per month per detailed server.Sign up today!