Monitor your Network Assets and Websites for Performance and Availability


Monitor your websites, connections, ports, APIs and other network assets. Configure the frequency at which CopperEgg should ‘ping’ your network assets.
Monitor webpage load times for real users (APDEX scores) and other real-user statistics
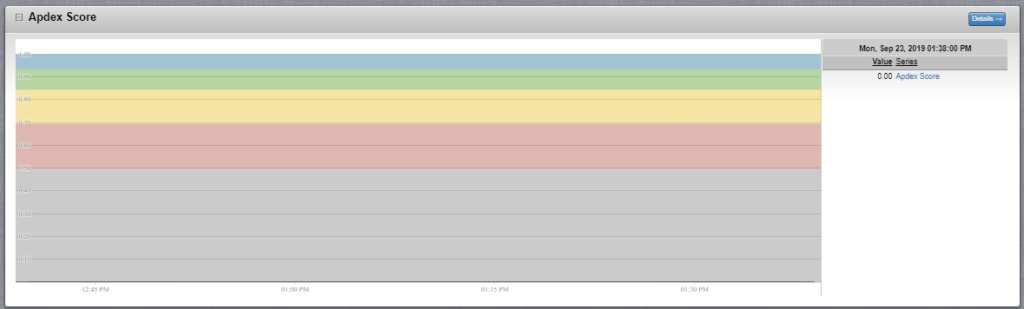
APDEX scores representing webpage load times
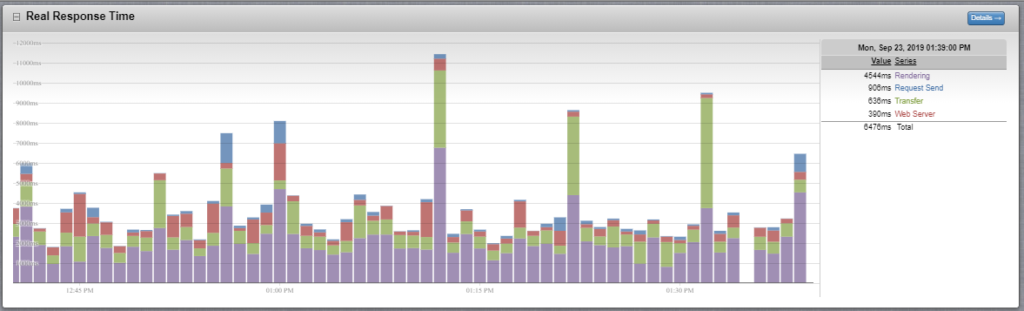
Website response times for real users
APDEX scores are an industry-standard measure of response times for a web application. CopperEgg helps Website developers measure the APDEX scores for your real users in real time.
CopperEgg also tracks the top URLs in your website based on frequency, the types of browsers used and the common user locations.
You can view this detailed step-by-step Guide to enable Real User Monitoring for your web application.
‘Ping’ your website using geographically dispersed Probe Stations
We have 15 Probe Stations that are geographically dispersed across the globe.
You can monitor your websites and other network assets from the probe stations that are relevant to you. You can view the aggregated response times as well as the response times for each specific Probe Station.
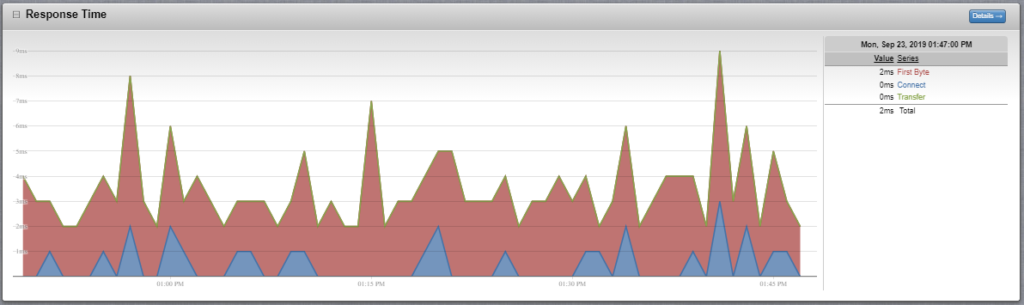
You can also see the breakdown – time to establish a connection, time to start data transfer and time to first byte (TTFB).
Smart Alerts
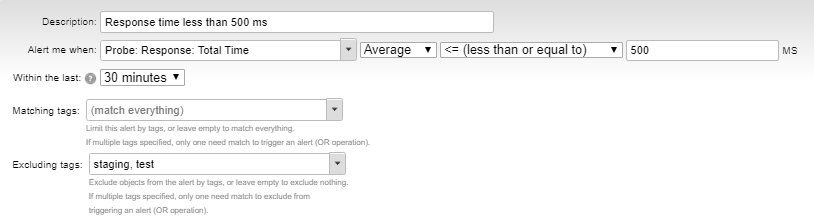
Leverage 5 out-of-the-box, pre-configured alerts to be notified about downtimes, slow response times and response validation errors. Configure alerts using our easy-to-use alert rules framework. Use tags to enable/ disable alerts for specific probe URLs. CopperEgg supports multiple channels for alert notifications – Email, SMS, twitter, PagerDuty, Hipchat, Campfire, Slack, Opsgenie and Custom Notification mechanisms.